Audi 2011 Annual Report Download - page 143
Download and view the complete annual report
Please find page 143 of the 2011 Audi annual report below. You can navigate through the pages in the report by either clicking on the pages listed below, or by using the keyword search tool below to find specific information within the annual report.-
 1
1 -
2
-
3
-
4
-
5
-
6
-
7
-
8
-
9
-
10
-
11
-
12
-
13
-
14
-
15
-
16
-
17
-
18
-
19
-
20
-
21
-
22
-
23
-
24
-
25
-
26
-
27
-
28
-
29
-
30
-
31
-
32
-
33
-
34
-
35
-
36
-
37
-
38
-
39
-
40
-
41
-
42
-
43
-
44
-
45
-
46
-
47
-
48
-
49
-
50
-
51
-
52
-
53
-
54
-
55
-
56
-
57
-
58
-
59
-
60
-
61
-
62
-
63
-
64
-
65
-
66
-
67
-
68
-
69
-
70
-
71
-
72
-
73
-
74
-
75
-
76
-
77
-
78
-
79
-
80
-
81
-
82
-
83
-
84
-
85
-
86
-
87
-
88
-
89
-
90
-
91
-
92
-
93
-
94
-
95
-
96
-
97
-
98
-
99
-
100
-
101
-
102
-
103
-
104
-
105
-
106
-
107
-
108
-
109
-
110
-
111
-
112
-
113
-
114
-
115
-
116
-
117
-
118
-
119
-
120
-
121
-
122
-
123
-
124
-
125
-
126
-
127
-
128
-
129
-
130
-
131
-
132
-
 133
133 -
 134
134 -
 135
135 -
 136
136 -
 137
137 -
 138
138 -
 139
139 -
 140
140 -
 141
141 -
 142
142 -
 143
143 -
 144
144 -
 145
145 -
 146
146 -
 147
147 -
 148
148 -
 149
149 -
 150
150 -
 151
151 -
 152
152 -
 153
153 -
154
-
155
-
156
-
157
-
158
-
159
-
160
-
161
-
162
-
163
-
164
-
165
-
166
-
167
-
168
-
169
-
170
-
171
-
172
-
173
-
174
-
175
-
176
-
177
-
178
-
179
-
180
-
181
-
182
-
183
-
184
-
185
-
186
-
187
-
188
-
189
-
190
-
191
-
192
-
193
-
194
-
195
-
196
-
197
-
198
-
199
-
200
-
201
-
202
-
203
-
204
-
205
-
206
-
207
-
208
-
209
-
210
-
211
-
212
-
213
-
214
-
215
-
216
-
217
-
218
-
219
-
220
-
221
-
222
-
223
-
224
-
225
-
226
-
227
-
228
-
229
-
230
-
231
-
232
-
233
-
234
-
235
-
236
-
237
-
238
-
239
-
240
-
241
-
242
-
243
-
244
-
245
-
246
-
247
-
248
-
249
-
250
-
251
-
252
-
253
-
254
-
255
-
256
-
257
-
258
-
259
-
260
-
261
-
262
-
263
-
264
-
265
-
266
-
267
-
268
-
269
-
270
-
271
 |
 |

140
Strategic target
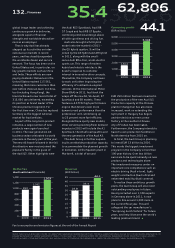
Consistently increasing the value of the Company is one of the Audi Group’s main objectives.
The return on investment (RoI) serves as a measure of the return on the capital employed for
different types and scales of investment projects. It reflects the development in a company’s
profitability and is calculated using the following formula:
Operating profit after tax
Average invested assets
Return on investment (RoI) = x 100
EUR million 2011 2010
Operating profit after tax 3,744 2,338
Average operating assets 15,177 13,327
– Average non-interest-bearing liabilities 4,607 3,855
= Average invested assets 10,571 9,472
Return on investment (in %) 35.4 24.7
The Audi Group achieved a return on investment of 35.4 percent in the past fiscal year. This
represented a further improvement on the prior-year figure of 24.7 percent. In terms of return
on investment, the Audi Group therefore ranks as one of the most profitable companies in the
automotive industry worldwide.
SHARES
Stock market developments
The year started with a continuation in the positive trend on stock markets, bolstered above all
by good corporate results. Having started the year at 6,973 points, the DAX for example forged
ahead to over 7,400 points by halfway through the first quarter. However, political unrest in
North Africa and the consequences of the natural disaster in Japan brought the DAX under in-
creasing pressure, prompting it to fall back to around 6,500 points by mid-March. After a brief
recovery the German lead index reached its year-high of 7,528 points in early May, then moved
mainly sideways until the end of the second quarter.
The mood progressively darkened as the year continued. The reasons were the deepening debt
crisis in Europe, uncertainty surrounding the raising of the debt ceiling in the United States and
growing concerns at a slowdown in the global economy, which together fueled fears of a renewed
financial crisis. These growing uncertainties periodically drove the German lead index below
5,000 points in the course of the third quarter.
The start of the final quarter brought growing confidence that a solution to Europe’s debt crisis
could be found before nervousness on financial markets spilled over into the real economy. Al-
though the DAX improved on its all-year low, developments throughout the rest of the fourth
quarter remained highly volatile.
The DAX closed the year on 5,898 points, well down on the position at the start of 2011.
Audi trading price trend
Audi shares started 2011 trading at EUR 650 and initially remained flat at the start of the year, in
line with other German automotive shares. As the year continued, Audi shares were subsequently
unable to resist the pattern of dramatic losses on stock markets worldwide following the natural
and nuclear disaster in Japan. The trading price had fallen to EUR 545 by mid-March. However,
the shares recovered swiftly and were almost back up where they had started the year by early
May, trading at EUR 640. Growing uncertainty on financial markets worldwide meant that Audi
shares also retreated to a corridor of EUR 580 to 615 between mid-May and early August.