Audi 2011 Annual Report Download - page 242
Download and view the complete annual report
Please find page 242 of the 2011 Audi annual report below. You can navigate through the pages in the report by either clicking on the pages listed below, or by using the keyword search tool below to find specific information within the annual report.-
 1
1 -
2
-
3
-
4
-
5
-
6
-
7
-
8
-
9
-
10
-
11
-
12
-
13
-
14
-
15
-
16
-
17
-
18
-
19
-
20
-
21
-
22
-
23
-
24
-
25
-
26
-
27
-
28
-
29
-
30
-
31
-
32
-
33
-
34
-
35
-
36
-
37
-
38
-
39
-
40
-
41
-
42
-
43
-
44
-
45
-
46
-
47
-
48
-
49
-
50
-
51
-
52
-
53
-
54
-
55
-
56
-
57
-
58
-
59
-
60
-
61
-
62
-
63
-
64
-
65
-
66
-
67
-
68
-
69
-
70
-
71
-
72
-
73
-
74
-
75
-
76
-
77
-
78
-
79
-
80
-
81
-
82
-
83
-
84
-
85
-
86
-
87
-
88
-
89
-
90
-
91
-
92
-
93
-
94
-
95
-
96
-
97
-
98
-
99
-
100
-
101
-
102
-
103
-
104
-
105
-
106
-
107
-
108
-
109
-
110
-
111
-
112
-
113
-
114
-
115
-
116
-
117
-
118
-
119
-
120
-
121
-
122
-
123
-
124
-
125
-
126
-
127
-
128
-
129
-
130
-
131
-
132
-
133
-
134
-
135
-
136
-
137
-
138
-
139
-
140
-
141
-
142
-
143
-
144
-
145
-
146
-
147
-
148
-
149
-
150
-
151
-
152
-
153
-
154
-
155
-
156
-
157
-
158
-
159
-
160
-
161
-
162
-
163
-
164
-
165
-
166
-
167
-
168
-
169
-
170
-
171
-
172
-
173
-
174
-
175
-
176
-
177
-
178
-
179
-
180
-
181
-
182
-
183
-
184
-
185
-
186
-
187
-
188
-
189
-
190
-
191
-
192
-
193
-
194
-
195
-
196
-
197
-
198
-
199
-
200
-
201
-
202
-
203
-
204
-
205
-
206
-
207
-
208
-
209
-
210
-
211
-
212
-
213
-
214
-
215
-
216
-
217
-
218
-
219
-
220
-
221
-
222
-
223
-
224
-
225
-
226
-
227
-
228
-
229
-
230
-
231
-
 232
232 -
 233
233 -
 234
234 -
 235
235 -
 236
236 -
 237
237 -
 238
238 -
 239
239 -
 240
240 -
 241
241 -
 242
242 -
 243
243 -
 244
244 -
 245
245 -
 246
246 -
 247
247 -
 248
248 -
 249
249 -
 250
250 -
 251
251 -
 252
252 -
253
-
254
-
255
-
256
-
257
-
258
-
259
-
260
-
261
-
262
-
263
-
264
-
265
-
266
-
267
-
268
-
269
-
270
-
271
 |
 |

239
Consolidated Financial
Statements
188 Income Statement
189 Statement of Recognized
Income and Expense
190 Balance Sheet
191 Cash Flow Statement
192 Statement of Changes in Equity
Notes to the Consolidated
Financial Statements
194 Development of fixed assets
in the 2011 fiscal year
196 Development of fixed assets
in the 2010 fiscal year
198 General information
204 Recognition and
measurement principles
212 Notes to the Income Statement
218 Notes to the Balance Sheet
227 Additional disclosures
248 Events occurring subsequent
to the balance sheet date
249 Statement of Interests
held by the Audi Group
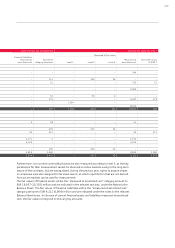
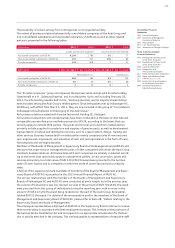
In the case of regression analysis, the performance of the underlying transaction is viewed as an
independent variable, while that of the hedging transaction is regarded as a dependent variable.
The transaction is classed as effective hedging if the coefficients of determination and escalation
factors are appropriate. All of the hedging relationships verified using this statistical method
proved to be effective as of the year-end date.
In 2011 there was ineffectiveness resulting from cash flow hedges amounting to
EUR 3 (10) million.
Nominal volume of cash flow hedges
The nominal volumes of the presented cash flow hedges for hedging currency risks and com-
modity price risks represent the total of all buying and selling prices on which the transactions
are based.
EUR million Nominal volumes
Dec. 31, 2011
Residual time
to maturity
up to 1 year
Residual time
to maturity
up to 5 years Dec. 31, 2010
Cash flow hedges 27,961 10,232 17,729 21,664
Foreign exchange contracts 27,156 10,011 17,145 20,330
Currency option transactions 454 144 310 989
Commodity futures 351 77 274 345
The derivative financial instruments used exhibit a maximum hedging term of five years.
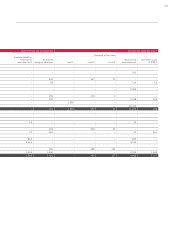
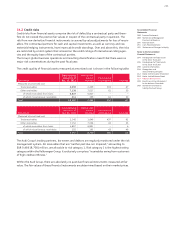
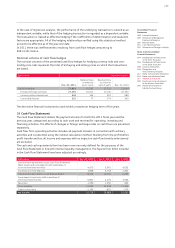
35 Cash Flow Statement
The Cash Flow Statement details the payment streams for both the 2011 fiscal year and the
previous year, categorized according to cash used and received for operating, investing and
financing activities. The effects of changes in foreign exchange rates on cash flows are presented
separately.
Cash flow from operating activities includes all payment streams in connection with ordinary
activities and is presented using the indirect calculation method. Starting from the profit before
profit transfer and tax, all income and expenses with no impact on cash flow (mainly write-downs)
are excluded.
The cash and cash equivalents item has been more narrowly defined for the purposes of the
Cash Flow Statement in line with internal liquidity management. The figures from 2010 included
in the Cash Flow Statement have been adjusted accordingly.
EUR million Dec. 31, 2011 Jan. 1, 2011 Jan. 1, 2010
Cash and cash equivalents as per Cash Flow Statement
(bank assets and cash deposits with maturities of
no more than three months) 4,675 5,961 4,053
Currently due fixed deposits 3,838 4,763 2,402
Cash and cash equivalents as per Balance Sheet 8,513 10,724 6,455
Fixed deposits and loans with maturities of
more than three months 6,801 2,134 3,965
Securities 1,596 1,350 824
Gross liquidity 16,909 14,208 11,244
Credit outstanding – 1,193 – 825 – 579
Net liquidity 15,716 13,383 10,665