Aflac 2006 Annual Report Download - page 76
Download and view the complete annual report
Please find page 76 of the 2006 Aflac annual report below. You can navigate through the pages in the report by either clicking on the pages listed below, or by using the keyword search tool below to find specific information within the annual report.-
 1
1 -
2
-
3
-
4
-
5
-
6
-
7
-
8
-
9
-
10
-
11
-
12
-
13
-
14
-
15
-
16
-
17
-
18
-
19
-
20
-
21
-
22
-
23
-
24
-
25
-
26
-
27
-
28
-
29
-
30
-
31
-
32
-
33
-
34
-
35
-
36
-
37
-
38
-
39
-
40
-
41
-
42
-
43
-
44
-
45
-
46
-
47
-
48
-
49
-
50
-
51
-
52
-
53
-
54
-
55
-
56
-
57
-
58
-
59
-
60
-
61
-
62
-
63
-
64
-
65
-
 66
66 -
 67
67 -
 68
68 -
 69
69 -
 70
70 -
 71
71 -
 72
72 -
 73
73 -
 74
74 -
 75
75 -
 76
76 -
 77
77 -
 78
78 -
 79
79 -
 80
80 -
 81
81 -
 82
82
 |
 |

72
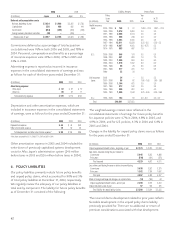
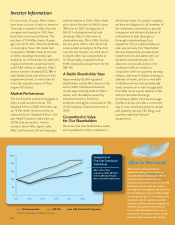
Unaudited Consolidated Quarterly Financial Data
In management’s opinion, this quarterly financial information fairly presents the results of operations for such periods and is
prepared on a basis consistent with our annual audited financial statements.
(In millions, except
for per-share amounts) March 31, 2006 June 30, 2006 September 30, 2006 December 31, 2006
Premium income $ 3,005 $3,093 $3,102 $3,114
Net investment income 524 542 548 557
Realized investment gains 14 50 11 5
Other income 16 12 11 11
Total revenues 3,559 3,697 3,672 3,687
Total benefits and expenses 2,984 3,073 3,115 3,180
Earnings before income taxes 575 624 557 507
Total income tax 200 216 190 175
Net earnings $ 375 $ 408 $ 367 $ 332
Net earnings per basic share $ .75 $ .82 $ .74 $ .67
Net earnings per diluted share .74 .81 .73 .67
March 31, 2005 June 30, 2005 September 30, 2005 December 31, 2005
Premium income $ 3,041 $ 3,020 $ 2,997 $ 2,931
Net investment income 514 518 522 517
Realized investment gains 3 11 140 108
Other income 1 18 10 11
Total revenues 3,559 3,567 3,669 3,567
Total benefits and expenses 3,053 3,051 3,024 3,008
Earnings before income taxes 506 516 645 559
Total income tax 178 180 190 195
Net earnings $ 328 $ 336 $ 455 $ 364
Net earnings per basic share $ .65 $ .67 $ .91 $ .73
Net earnings per diluted share .64 .66 .90 .72
Quarterly amounts may not agree in total to the corresponding annual amounts due to rounding.
Management is responsible for establishing and maintaining adequate internal control over financial reporting, as such term is
defined in Exchange Act Rules 13a-15(f). Under the supervision and with the participation of our management, including our
principal executive officer and principal financial officer, we conducted an evaluation of the effectiveness of our internal control
over financial reporting based on the framework in Internal Control – Integrated Framework issued by the Committee of
Sponsoring Organizations of the Treadway Commission. Based on our evaluation under this framework, management has
concluded that our internal control over financial reporting was effective as of December 31, 2006.
KPMG LLP, an independent registered public accounting firm, has issued an audit report on management’s assessment of the
effectiveness of internal control over financial reporting as of December 31, 2006, as stated in their report, which is included herein.
Management’s Annual Report on Internal Control over Financial Reporting