Aflac 2006 Annual Report Download - page 38
Download and view the complete annual report
Please find page 38 of the 2006 Aflac annual report below. You can navigate through the pages in the report by either clicking on the pages listed below, or by using the keyword search tool below to find specific information within the annual report.-
 1
1 -
2
-
3
-
4
-
5
-
6
-
7
-
8
-
9
-
10
-
11
-
12
-
13
-
14
-
15
-
16
-
17
-
18
-
19
-
20
-
21
-
22
-
23
-
24
-
25
-
26
-
27
-
 28
28 -
 29
29 -
 30
30 -
 31
31 -
 32
32 -
 33
33 -
 34
34 -
 35
35 -
 36
36 -
 37
37 -
 38
38 -
 39
39 -
 40
40 -
 41
41 -
 42
42 -
 43
43 -
 44
44 -
 45
45 -
 46
46 -
 47
47 -
 48
48 -
49
-
50
-
51
-
52
-
53
-
54
-
55
-
56
-
57
-
58
-
59
-
60
-
61
-
62
-
63
-
64
-
65
-
66
-
67
-
68
-
69
-
70
-
71
-
72
-
73
-
74
-
75
-
76
-
77
-
78
-
79
-
80
-
81
-
82
 |
 |

34
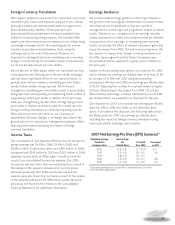
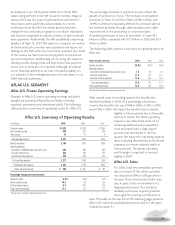
Our objective for 2007 is to increase total new annualized
premium sales by 6% to 10%.
The following table details the contributions to total new
annualized premium sales by major product category for the
years ended December 31.
One aspect of our growth strategy is the continued
enhancement of our product line. During the third quarter of
2006, we launched revised specified health event and
intensive care plans. In 2007 we will introduce an innovative
care policy that provides benefits to help offset costs
associated with caring for dependents as a result of their
accident or illness.
Another aspect of our growth strategy is our focus on growing
and improving our U.S. sales force, and we were encouraged
to see continued expansion in 2006. Although we did not set
a specific recruiting target for 2006, we continued to
emphasize recruiting as a means for growing our producer
base. We recruited more than 26,000 new associates during
2006, which was 7.8% higher than 2005. At December 31,
2006, Aflac U.S. was represented by more than 68,300
licensed sales associates, which was 8.5% higher than a year
ago. Our primary focus has been on increasing producing sales
associates. We believe that we can achieve better producer
growth through more effective and standardized training for
our sales associates and sales management. On an average
weekly basis, the number of producing associates rose 6.4% in
2006 to approximately 10,300, compared with a year ago. As
previously disclosed, our focus has shifted from average
monthly producers to average weekly producers as both a
reporting and management metric. This shift provides for a
more active management of our sales associates and allows
our sales management to monitor progress and needs on a
real-time basis.
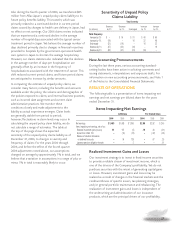
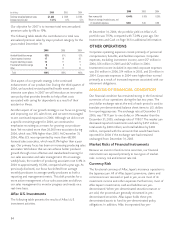
Aflac U.S. Investments
The following table presents the results of Aflac’s U.S.
investment activities.
At December 31, 2006, the portfolio yield on Aflac’s U.S.
portfolio was 7.15%, compared with 7.24% a year ago. See
Investments and Cash on Page 36 for additional information.
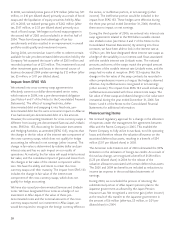
OTHER OPERATIONS
Corporate operating expenses consist primarily of personnel
compensation, benefits, and facilities expenses. Corporate
expenses, excluding investment income, were $57 million in
2006, $56 million in 2005 and $67 million in 2004.
Investment income included in reported corporate expenses
was $16 million in 2006, $14 million in 2005, and $5 million in
2004. Corporate expenses in 2004 were higher than normal
primarily as a result of increased expenses associated with our
retirement obligations.
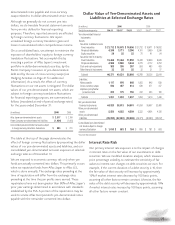
ANALYSIS OF FINANCIAL CONDITION
Our financial condition has remained strong in the functional
currencies of our operations during the last two years. The
yen/dollar exchange rate at the end of each period is used to
translate yen-denominated balance sheet items to U.S. dollars
for reporting purposes. The exchange rate at December 31,
2006, was 119.11 yen to one dollar, or .9% weaker than the
December 31, 2005, exchange rate of 118.07. The weaker yen
decreased reported investments and cash by $357 million;
total assets by $400 million; and total liabilities by $392
million, compared with the amounts that would have been
reported for 2006 if the exchange rate had remained
unchanged from December 31, 2005.
Market Risks of Financial Instruments
Because we invest in fixed-income securities, our financial
instruments are exposed primarily to two types of market
risks: currency risk and interest rate risk.
Currency Risk
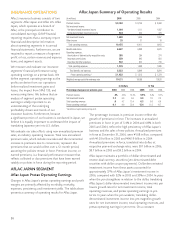
The functional currency of Aflac Japan’s insurance operation is
the Japanese yen. All of Aflac Japan’s premiums, claims and
commissions are received or paid in yen, as are most of its
investment income and other expenses. Furthermore, most of
Aflac Japan’s investments, cash and liabilities are yen-
denominated. When yen-denominated securities mature or
are sold, the proceeds are generally reinvested in yen-
denominated securities. Aflac Japan holds these yen-
denominated assets to fund its yen-denominated policy
obligations. In addition, Aflac Incorporated has yen-
2006 2005 2004
Accident/disability coverage 52% 51% 52%
Cancer expense insurance 17 19 20
Hospital indemnity products 12 11 11
Fixed-benefit dental coverage 687
Other 13 11 10
Total 100% 100% 100%
2006 2005 2004
New money yield 6.44% 6.16% 6.30%
Return on average invested assets, net
of investment expenses 6.86 6.54 6.68
(In millions) 2006 2005 2004
Total new annualized premium sales $ 1,423 $ 1,259 $ 1,186
Increase over prior year 13.1% 6.1% 5.1%