Aflac 2006 Annual Report Download - page 16
Download and view the complete annual report
Please find page 16 of the 2006 Aflac annual report below. You can navigate through the pages in the report by either clicking on the pages listed below, or by using the keyword search tool below to find specific information within the annual report.-
 1
1 -
2
-
3
-
4
-
5
-
 6
6 -
 7
7 -
 8
8 -
 9
9 -
 10
10 -
 11
11 -
 12
12 -
 13
13 -
 14
14 -
 15
15 -
 16
16 -
 17
17 -
 18
18 -
 19
19 -
 20
20 -
 21
21 -
 22
22 -
 23
23 -
 24
24 -
 25
25 -
 26
26 -
27
-
28
-
29
-
30
-
31
-
32
-
33
-
34
-
35
-
36
-
37
-
38
-
39
-
40
-
41
-
42
-
43
-
44
-
45
-
46
-
47
-
48
-
49
-
50
-
51
-
52
-
53
-
54
-
55
-
56
-
57
-
58
-
59
-
60
-
61
-
62
-
63
-
64
-
65
-
66
-
67
-
68
-
69
-
70
-
71
-
72
-
73
-
74
-
75
-
76
-
77
-
78
-
79
-
80
-
81
-
82
 |
 |

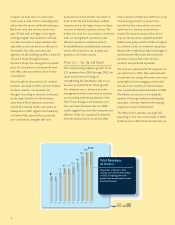
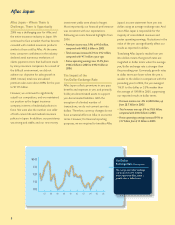
Aflac Japan
Sales Results
Despite weaker than expected
sales in 2006, annualized
premiums in force rose 5.4%.
Empowering Our
Sales Force for Action
We continued to build on our multi-faceted
distribution system in 2006. Our broad sales
network includes affiliated corporate
agencies, independent corporate agencies
and individual agencies. In 2006, we
recruited about 3,400 new sales agencies. At
the end of the year, Aflac Japan was
represented by more than 18,400 sales
agencies, including more than 90,000
licensed sales associates.
Sales through our affiliated corporate agency
channel have slowed for several years due to
changed employment patterns and
consumers’ desire for consultation on how
the products meet their specific needs.
However, we still consider the affiliated
corporate channel an important part of our
distribution system and believe it is a
valuable means for reaching workers at large
employers. To rejuvenate this channel, we
are encouraging our affiliated agencies to
move away from passive, or “pull” sales
tactics, like direct mailings and newspaper
ads, and instead adopt active, or “push”
techniques that involve more follow-up calls
and face-to-face sales consultations.
To improve the overall effectiveness of our
sales force, we started a new training
initiative. This new training program uses six
months of classroom training and practical
field training to equip sales associates with
the skills necessary for their success. By the
end of 2006, we had trained more than 700
of Aflac Japan’s field employees, who in
turn, are now positioned to train primarily
newly recruited sales associates.
Aflac Service Shops, which are primarily
owned and operated by individual sales
agencies, are gaining in popularity as many
consumers in Japan seek one-on-one
consultation and convenience in handling
their insurance needs. By the end of 2006,
we had 570 Aflac Service Shops throughout
Japan.
We also continued to reach consumers
through our strategic marketing alliance with
Dai-ichi Mutual Life. We believe our alliance
has been one of the most successful
partnerships in the insurance industry. In
2006, Dai-ichi Life sold nearly 270,000 of
our market leading cancer life policies,
enabling Dai-ichi Life to retain its distinction
as the number two seller of cancer insurance
behind only Aflac Japan.
We expect that our distribution will
continue to evolve in Japan, especially with
the prospects for expanding our business
when the bank distribution channel opens
up for our type of products, which is
scheduled for the end of December 2007.
Although there will undoubtedly be a lot of
competition for bank distribution, we have
established long-term relationships with
many banks throughout Japan, and we’re
excited about the opportunity to grow our
business through this channel beginning
in 2008.
Technology Creates
Efficiencies of Heroic Proportion
Technology has been a key component of
Aflac Japan’s most noteworthy competitive
strength – administrative efficiency. Our
maintenance expenses per policy in force
are significantly lower than every other life
insurance company in Japan, allowing us to
12
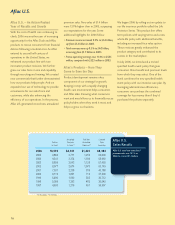
Policies Annualized Total New Total
and Riders Premiums Annualized Number of
In Force* In Force** Premiums** Agencies
2006 27,334 ¥1,083,127 ¥117,455 18,432
2005 26,014 1,027,762 128,784 17,960
2004 24,477 961,895 122,525 16,410
2003 23,097 900,251 121,170 14,643
2002 21,867 834,424 108,320 12,056
2001 20,802 782,249 91,865 9,839
2000 19,674 740,445 99,755 8,938
1999 18,510 696,622 87,043 8,283
1998 16,963 640,796 75,425 7,010
1997 15,800 597,823 62,884 5,427
*In thousands **In millions