Aflac 2006 Annual Report Download - page 35
Download and view the complete annual report
Please find page 35 of the 2006 Aflac annual report below. You can navigate through the pages in the report by either clicking on the pages listed below, or by using the keyword search tool below to find specific information within the annual report.-
 1
1 -
2
-
3
-
4
-
5
-
6
-
7
-
8
-
9
-
10
-
11
-
12
-
13
-
14
-
15
-
16
-
17
-
18
-
19
-
20
-
21
-
22
-
23
-
24
-
 25
25 -
 26
26 -
 27
27 -
 28
28 -
 29
29 -
 30
30 -
 31
31 -
 32
32 -
 33
33 -
 34
34 -
 35
35 -
 36
36 -
 37
37 -
 38
38 -
 39
39 -
 40
40 -
 41
41 -
 42
42 -
 43
43 -
 44
44 -
 45
45 -
46
-
47
-
48
-
49
-
50
-
51
-
52
-
53
-
54
-
55
-
56
-
57
-
58
-
59
-
60
-
61
-
62
-
63
-
64
-
65
-
66
-
67
-
68
-
69
-
70
-
71
-
72
-
73
-
74
-
75
-
76
-
77
-
78
-
79
-
80
-
81
-
82
 |
 |

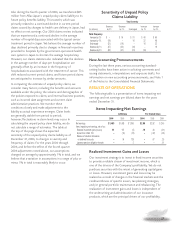
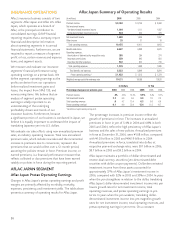
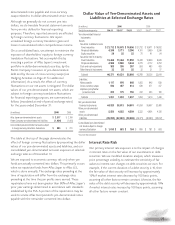
currency basis, dollar-denominated investment income
accounted for approximately 36% of Aflac Japan’s investment
income during 2006, compared with 32% in both 2005 and
2004. The following table illustrates the effect of translating
Aflac Japan’s dollar-denominated investment income and
related items into yen by comparing certain segment results
with those that would have been reported had yen/dollar
exchange rates remained unchanged from the prior year.
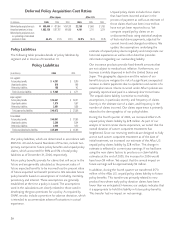
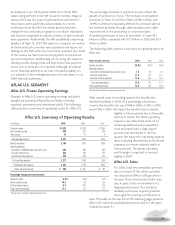
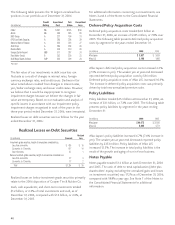
The following table presents a summary of operating ratios
for Aflac Japan.
The benefit ratio has declined over the past several years,
reflecting the impact of newer products with lower loss ratios.
We have also experienced favorable claim trends in our major
product lines. We expect the benefit ratio to continue to
decline in future years primarily reflecting the shift to newer
products and riders. However, this decline is partially offset by
the effect of low investment yields, which impacts our profit
margin by reducing the spread between investment yields and
required interest on policy reserves (see table and discussion
on Page 36). The operating expense ratio was higher in 2005
as a result of additional advertising expenditures and the
write-off of previously capitalized systems development costs.
We expect the operating expense ratio to be relatively stable
in 2007. Due to improvement in the benefit ratio, the pretax
operating profit margin expanded to 15.8% in 2006. We
expect continued expansion in the profit margin in 2007.
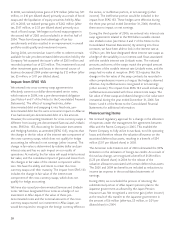
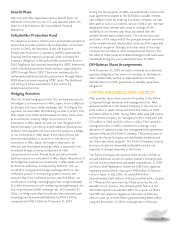
Aflac Japan Sales
Aflac Japan’s total new annualized premium sales declined
8.8% in 2006. The sales decline primarily reflected industry-
wide weakness in the market for stand-alone medical
insurance as well as continued declines in the sale of Rider
MAX. The following table presents Aflac Japan’s total new
annualized premium sales for the years ended December 31.
Aflac Japan’s sales mix has been shifting during the last few
years. The following table details the contributions to total
new annualized premium sales by major product for the years
ended December 31.
We believe the 2006 sales decline for our medical product
category primarily reflected consumers’ concern over the
claims-paying issues facing the industry in general. We expect
this weakness will continue into 2007. However, with
continued cost pressure on Japan’s health care system, we
expect demand for medical products will continue to rise in
the future and we remain encouraged about the outlook for
the medical insurance market. Although that market is very
competitive, Aflac Japan retains the distinction of being the
number one seller of stand-alone medical insurance in Japan.
We believe that our number one position benefits us in the
marketplace. As a result, we continue to believe that the
medical category will be an important part of our product
portfolio.
The ordinary life category increased 16.9% in 2006, benefiting
from the sale of WAYS, the innovative life insurance product
we introduced in January 2006. Unlike traditional life
insurance, WAYS allows a policyholder to convert a portion of
the life insurance coverage to medical, nursing care, or fixed
annuity benefits at retirement age. We remain very pleased
with the initial response to WAYS, which accounted for
approximately 8% of new sales in 2006.
Ratios to total revenues in dollars: 2006 2005 2004
Benefits and claims 65.4% 66.2% 67.2%
Operating expenses:
Amortization of deferred policy acquisition costs 2.7 2.7 2.8
Insurance commissions 8.2 8.6 8.9
Insurance and other expenses 7.9 8.0 7.2
Total operating expenses 18.8 19.3 18.9
Pretax operating earnings* 15.8 14.5 13.9
*See Page 30 for our definition of segment operating earnings.
In Dollars In Yen
(In millions of dollars
and billions of yen) 2006 2005 2004 2006 2005 2004
Total new annualized
premium sales $ 1,010 $ 1,167 $ 1,133 ¥ 117.5 ¥ 128.8 ¥ 122.5
Percentage change
over prior year (13.5)% 3.0% 8.2% (8.8)% 5.1% 1.1%
2006 2005 2004
Medical policies 33% 37% 31%
Cancer life 28 26 23
Ordinary life 23 18 19
Rider MAX 10 11 20
Other 687
Total 100% 100% 100%
31
Aflac Japan Percentage
Changes Over Prior Year
(Yen Operating Results)
Including Foreign Excluding Foreign
Currency Changes *Currency Changes**
2006 2005 2004 2006 2005 2004
Net investment income 9.0% 7.0% 2.3% 6.8% 6.3% 4.5%
Total operating revenues 6.3 6.6 6.0 6.0 6.4 6.3
Pretax operating earnings* 15.4 11.5 14.7 13.3 10.8 15.3
*See Page 30 for our definition of segment operating earnings.
**Amounts excluding foreign currency changes on dollar-denominated items were determined using the same yen/dollar
**exchange rate for the current year as each respective prior year.