Aflac 2006 Annual Report Download - page 46
Download and view the complete annual report
Please find page 46 of the 2006 Aflac annual report below. You can navigate through the pages in the report by either clicking on the pages listed below, or by using the keyword search tool below to find specific information within the annual report.-
 1
1 -
2
-
3
-
4
-
5
-
6
-
7
-
8
-
9
-
10
-
11
-
12
-
13
-
14
-
15
-
16
-
17
-
18
-
19
-
20
-
21
-
22
-
23
-
24
-
25
-
26
-
27
-
28
-
29
-
30
-
31
-
32
-
33
-
34
-
35
-
 36
36 -
 37
37 -
 38
38 -
 39
39 -
 40
40 -
 41
41 -
 42
42 -
 43
43 -
 44
44 -
 45
45 -
 46
46 -
 47
47 -
 48
48 -
 49
49 -
 50
50 -
 51
51 -
 52
52 -
 53
53 -
 54
54 -
 55
55 -
 56
56 -
57
-
58
-
59
-
60
-
61
-
62
-
63
-
64
-
65
-
66
-
67
-
68
-
69
-
70
-
71
-
72
-
73
-
74
-
75
-
76
-
77
-
78
-
79
-
80
-
81
-
82
 |
 |

42
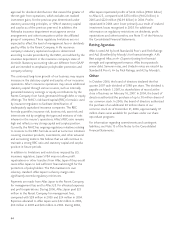
notes in Japan. If issued, these securities will
not be available to U.S. persons. We also filed
an SRS in August 2006 with Japanese
regulatory authorities to issue up to ¥100
billion (approximately $840 million using the
December 31, 2006, period-end exchange
rate) of Uridashi notes in Japan. In
September 2006, the Parent Company issued
¥45 billion of yen-denominated Uridashi
notes from this SRS. If issued, the remaining
¥55 billion of yen-denominated Uridashi
notes will not be available to U.S. persons.
We believe outside sources for additional
debt and equity capital, if needed, will
continue to be available. For additional information, see Note
7 of the Notes to the Consolidated Financial Statements.
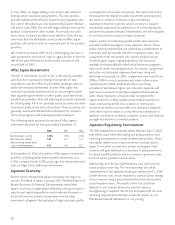
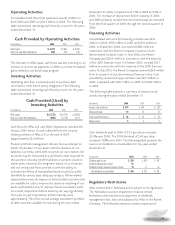
The principal sources of cash for our insurance operations are
premiums and investment income. The primary uses of cash
by our insurance operations are policy claims, commissions,
operating expenses, income taxes and payments to the Parent
Company for management fees and dividends. Both the
sources and uses of cash are reasonably predictable.
When making an investment decision, our first consideration
is based on product needs. Our investment objectives provide
for liquidity through the purchase of investment-grade debt
securities. These objectives also take into account duration
matching, and because of the long-term nature of our
business, we have adequate time to react to changing cash
flow needs.
As a result of policyholder aging, claims payments are
expected to gradually increase over the life of a policy.
Therefore, future policy benefit reserves are accumulated in
the early years of a policy and are designed to help fund
future claims payments. We expect our future cash flows from
premiums and our investment portfolio to be sufficient to
meet our cash needs for benefits and
expenses.
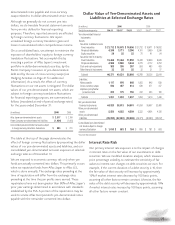
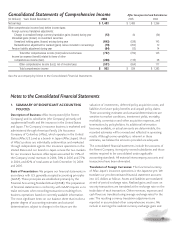
The table at the top of the page presents
the estimated payments by period of our
major contractual obligations as of
December 31, 2006. We translated our
yen-denominated obligations using the
December 31, 2006, exchange rate.
Actual future payments as reported in
dollars will fluctuate with changes in the
yen/dollar exchange rate.
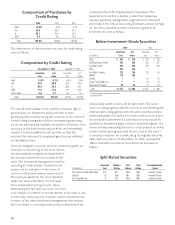
The distribution of payments for future policy benefits is an
estimate of all future benefit payments for policies in force as
of December 31, 2006. These projected values contain
assumptions for future policy persistency, mortality and
morbidity. The distribution of payments for unpaid policy
claims includes assumptions as to the timing of policyholders
reporting claims for prior periods and the amount of those
claims. Actual amounts and timing of both future policy
benefits and unpaid policy claims payments may differ
significantly from the estimates above. We anticipate that the
future policy benefit liability of $40.8 billion at December 31,
2006, along with future net premiums and investment
income, will be sufficient to fund future policy benefit
payments.
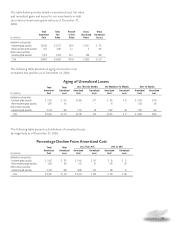
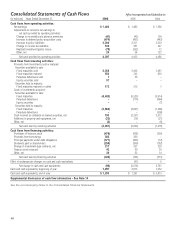
Consolidated Cash Flows
We translate cash flows for Aflac Japan’s yen-denominated
items into U.S. dollars using weighted-average exchange rates.
In years when the yen weakens, translating yen into dollars
causes fewer dollars to be reported. When the yen
strengthens, translating yen into dollars causes more dollars to
be reported. The following table summarizes consolidated
cash flows by activity for the years ended December 31.
Distribution of Payments by Period
Total Total Less Than One to Four to After
(In millions) *Liability* Payments One Year Three Years Five Years Five Years
Future policy benefits liability $ 40,841 $ 208,221 $ 6,403 $ 12,791 $ 12,496 $ 176,531
Unpaid policy claims liability 2,390 2,390 1,794 378 130 88
Long-term debt – principal 1,416 1,416 252 450 630 84
Long-term debt – interest 4 71 18 30 14 9
Policyholder protection fund 175 175 29 47 53 46
Operating service agreements N/A** 530 47 128 121 234
Operating lease obligations N/A** 143 42 36 19 46
Capitalized lease obligations 10 10 4 5 1 –
Total contractual obligations $ 44,836 $ 212,956 $ 8,589 $ 13,865 $ 13,464 $ 177,038
* *Liability amounts are those reported on the consolidated balance sheet as of December 31, 2006.
**Not applicable
Consolidated Cash Flows by Activity
(In millions) 2006 2005
2004
Operating activities $ 4,397 $ 4,433 $ 4,486
Investing activities (4,057) (6,692) (1,418)
Financing activities (434) (196) (313)
Exchange effect on cash and cash equivalents –(61) 6
Net change in cash and cash equivalents $ (94) $ (2,516) $ 2,761