Aflac 2006 Annual Report Download - page 44
Download and view the complete annual report
Please find page 44 of the 2006 Aflac annual report below. You can navigate through the pages in the report by either clicking on the pages listed below, or by using the keyword search tool below to find specific information within the annual report.-
 1
1 -
2
-
3
-
4
-
5
-
6
-
7
-
8
-
9
-
10
-
11
-
12
-
13
-
14
-
15
-
16
-
17
-
18
-
19
-
20
-
21
-
22
-
23
-
24
-
25
-
26
-
27
-
28
-
29
-
30
-
31
-
32
-
33
-
 34
34 -
 35
35 -
 36
36 -
 37
37 -
 38
38 -
 39
39 -
 40
40 -
 41
41 -
 42
42 -
 43
43 -
 44
44 -
 45
45 -
 46
46 -
 47
47 -
 48
48 -
 49
49 -
 50
50 -
 51
51 -
 52
52 -
 53
53 -
 54
54 -
55
-
56
-
57
-
58
-
59
-
60
-
61
-
62
-
63
-
64
-
65
-
66
-
67
-
68
-
69
-
70
-
71
-
72
-
73
-
74
-
75
-
76
-
77
-
78
-
79
-
80
-
81
-
82
 |
 |

40
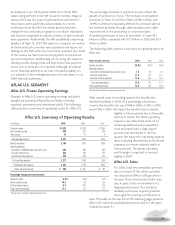
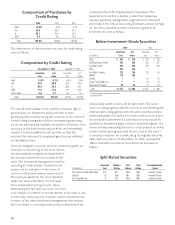
The following table presents the 10 largest unrealized loss
positions in our portfolio as of December 31, 2006.
The fair value of our investments in debt securities can
fluctuate as a result of changes in interest rates, foreign
currency exchange rates, and credit issues. Declines in fair
value noted above resulted from changes in interest rates,
yen/dollar exchange rates, and issuer credit status. However,
we believe that it would be inappropriate to recognize
impairment charges because we believe the changes in fair
value are temporary. Based on our evaluation and analysis of
specific issuers in accordance with our impairment policy,
impairment charges recognized in each of the years in the
three-year period ended December 31, 2006, were immaterial.
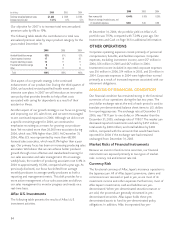
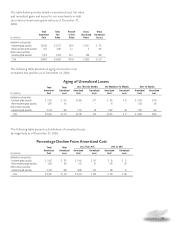
Realized losses on debt securities were as follows for the year
ended December 31, 2006:
Realized losses on below-investment-grade securities primarily
relate to the 2006 disposition of Cooper Tire & Rubber Co.
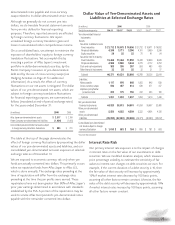
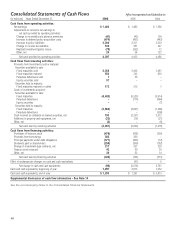
Cash, cash equivalents, and short-term investments totaled
$1.2 billion, or 2.3% of total investments and cash, as of
December 31, 2006, compared with $1.3 billion, or 2.6%, at
December 31, 2005.
For additional information concerning our investments, see
Notes 3 and 4 of the Notes to the Consolidated Financial
Statements.
Deferred Policy Acquisition Costs
Deferred policy acquisition costs totaled $6.0 billion at
December 31, 2006, an increase of $435 million, or 7.8% over
2005. The following table presents deferred policy acquisition
costs by segment for the years ended December 31.
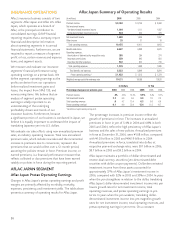
Aflac Japan’s deferred policy acquisition costs increased 6.4%
(7.4% increase in yen). The weaker yen at year-end decreased
reported deferred policy acquisition costs by $34 million.
Deferred policy acquisition costs of Aflac U.S. increased 10.3%.
The increase in deferred policy acquisition costs was primarily
driven by total new annualized premium sales.
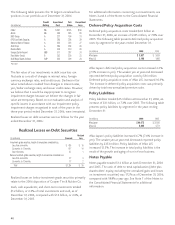
Policy Liabilities
Policy liabilities totaled $45.4 billion at December 31, 2006, an
increase of $3.1 billion, or 7.3% over 2005. The following table
presents policy liabilities by segment for the years ending
December 31.
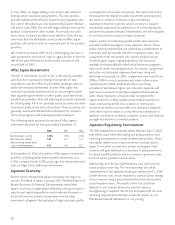
Aflac Japan’s policy liabilities increased 6.7% (7.6% increase in
yen). The weaker yen at year-end decreased reported policy
liabilities by $353 million. Policy liabilities of Aflac U.S.
increased 12.5%. The increase in total policy liabilities is the
result of the growth and aging of our in-force business.
Notes Payable
Notes payable totaled $1.4 billion at both December 31, 2006
and 2005. The ratio of debt to total capitalization (debt plus
shareholders’ equity, excluding the unrealized gains and losses
on investment securities) was 17.2% as of December 31, 2006,
compared with 18.8% a year ago. See Note 7 of the Notes to
the Consolidated Financial Statements for additional
information.
Credit Amortized Fair Unrealized
(In millions) Rating Cost Value Loss
CSAV BB $ 201 $ 145 $ 56
Ahold BB 300 245 55
KBC Group A 227 196 31
EFG Euro Bank Ergasias A 285 256 29
National Bank of Greece A 252 225 27
SLM Corp A 284 258 26
Nordea Bank A 336 310 26
Unique Zurich Airport BBB 311 287 24
Ford Motor Credit B 252 229 23
KLM Royal Dutch Airlines N/R* 252 229 23
*Not rated
Realized Losses on Debt Securities
Realized
(In millions)
Proceeds Loss
Investment-grade securities, length of consecutive unrealized loss:
Less than six months $ 426 $ 15
Six months to 12 months 617 14
Over 12 months 37 1
Below-investment-grade securities, length of consecutive unrealized loss:
Less than six months 37 3
Six months to 12 months 17 2
Total $ 1,134 $ 35
(In millions)
2006 2005
Aflac Japan $ 3,857 $ 3,624
Aflac U.S. 2,168 1,966
(In millions)
2006
2005
Aflac Japan $ 40,072 $ 37,556
Aflac U.S. 5,365 4,771