Aflac 2006 Annual Report Download - page 60
Download and view the complete annual report
Please find page 60 of the 2006 Aflac annual report below. You can navigate through the pages in the report by either clicking on the pages listed below, or by using the keyword search tool below to find specific information within the annual report.-
 1
1 -
2
-
3
-
4
-
5
-
6
-
7
-
8
-
9
-
10
-
11
-
12
-
13
-
14
-
15
-
16
-
17
-
18
-
19
-
20
-
21
-
22
-
23
-
24
-
25
-
26
-
27
-
28
-
29
-
30
-
31
-
32
-
33
-
34
-
35
-
36
-
37
-
38
-
39
-
40
-
41
-
42
-
43
-
44
-
45
-
46
-
47
-
48
-
49
-
 50
50 -
 51
51 -
 52
52 -
 53
53 -
 54
54 -
 55
55 -
 56
56 -
 57
57 -
 58
58 -
 59
59 -
 60
60 -
 61
61 -
 62
62 -
 63
63 -
 64
64 -
 65
65 -
 66
66 -
 67
67 -
 68
68 -
 69
69 -
 70
70 -
71
-
72
-
73
-
74
-
75
-
76
-
77
-
78
-
79
-
80
-
81
-
82
 |
 |

56
2006 2005
Cost Gross Gross Cost Gross Gross
or Amortized Unrealized Unrealized Fair or Amortized Unrealized Unrealized Fair
(In millions) Cost Gains Losses Value Cost Gains Losses Value
Securities available for sale, carried at fair value:
Fixed maturities:
Yen-denominated:
Government and guaranteed $ 8,286 $ 733 $ 48 $ 8,971 $ 8,686 $ 1,033 $ 34 $ 9,685
Mortgage- and asset-backed securities 190 1 1 190 4–– 4
Public utilities 1,575 165 14 1,726 1,560 200 24 1,736
Sovereign and supranational 794 57 22 829 859 75 30 904
Banks/financial institutions 3,482 292 50 3,724 3,433 342 49 3,726
Other corporate 3,547 173 183 3,537 2,952 168 205 2,915
Total yen-denominated 17,874 1,421 318 18,977 17,494 1,818 342 18,970
Dollar-denominated:
Government 431 3 10 424 375 5 6 374
Municipalities 105 4 – 109 76 6 – 82
Mortgage- and asset-backed securities 356 3 6 353 290 6 5 291
Collateralized debt obligations 20 – – 20 ––– –
Public utilities 921 87 6 1,002 869 113 2 980
Sovereign and supranational 394 74 – 468 398 83 – 481
Banks/financial institutions 3,329 229 21 3,537 2,825 294 6 3,113
Other corporate 3,669 305 59 3,915 3,533 382 64 3,851
Total dollar-denominated 9,225 705 102 9,828 8,366 889 83 9,172
Total fixed maturities 27,099 2,126 420 28,805 25,860 2,707 425 28,142
Perpetual debentures:
Yen-denominated:
Primarily banks/financial institutions 3,656 197 143 3,710 3,571 234 146 3,659
Dollar-denominated:
Banks/financial institutions 685 25 12 698 684 37 10 711
Total perpetual debentures 4,341 222 155 4,408 4,255 271 156 4,370
Equity securities 16 9 – 25 30 54 – 84
Total securities available for sale $ 31,456 $ 2,357 $ 575 $ 33,238 $ 30,145 $ 3,032 $ 581 $ 32,596
Securities held to maturity, carried at amortized cost:
Fixed maturities:
Yen-denominated:
Mortgage- and asset-backed securities $ 42 $ – $ – $ 42 $ 44 $ – $ – $ 44
Collateralized debt obligations 134 – 2 132 ––– –
Public utilities 1,567 31 50 1,548 1,213 28 49 1,192
Sovereign and supranational 2,783 90 35 2,838 2,478 95 53 2,520
Banks/financial institutions 6,913 98 336 6,675 5,152 115 273 4,994
Other corporate 2,025 112 22 2,115 1,962 125 16 2,071
Total yen-denominated 13,464 331 445 13,350 10,849 363 391 10,821
Dollar-denominated:
Government 19 – – 19 18 – – 18
Total dollar-denominated 19 – – 19 18 – – 18
Total fixed maturities 13,483 331 445 13,369 10,867 363 391 10,839
Perpetual debentures:
Yen-denominated:
Banks/financial institutions 3,990 156 122 4,024 4,172 201 121 4,252
Total perpetual debentures 3,990 156 122 4,024 4,172 201 121 4,252
Total securities held to maturity $ 17,473 $ 487 $ 567 $ 17,393 $ 15,039 $ 564 $ 512 $ 15,091
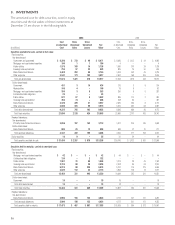
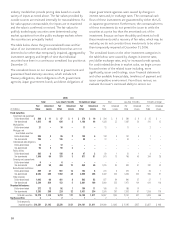
3. INVESTMENTS
The amortized cost for debt securities, cost for equity
securities and the fair values of these investments at
December 31 are shown in the following table.