Aflac 2006 Annual Report Download - page 43
Download and view the complete annual report
Please find page 43 of the 2006 Aflac annual report below. You can navigate through the pages in the report by either clicking on the pages listed below, or by using the keyword search tool below to find specific information within the annual report.-
 1
1 -
2
-
3
-
4
-
5
-
6
-
7
-
8
-
9
-
10
-
11
-
12
-
13
-
14
-
15
-
16
-
17
-
18
-
19
-
20
-
21
-
22
-
23
-
24
-
25
-
26
-
27
-
28
-
29
-
30
-
31
-
32
-
 33
33 -
 34
34 -
 35
35 -
 36
36 -
 37
37 -
 38
38 -
 39
39 -
 40
40 -
 41
41 -
 42
42 -
 43
43 -
 44
44 -
 45
45 -
 46
46 -
 47
47 -
 48
48 -
 49
49 -
 50
50 -
 51
51 -
 52
52 -
 53
53 -
54
-
55
-
56
-
57
-
58
-
59
-
60
-
61
-
62
-
63
-
64
-
65
-
66
-
67
-
68
-
69
-
70
-
71
-
72
-
73
-
74
-
75
-
76
-
77
-
78
-
79
-
80
-
81
-
82
 |
 |

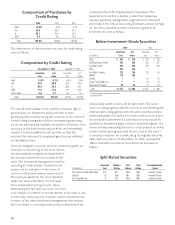
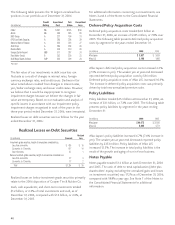
The table below provides details on amortized cost, fair value
and unrealized gains and losses for our investments in debt
securities by investment-grade status as of December 31,
2006.
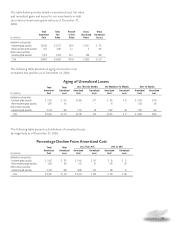
The following table presents an aging of securities in an
unrealized loss position as of December 31, 2006.
The following table presents a distribution of unrealized losses
by magnitude as of December 31, 2006.
Total Total Percent Gross Gross
Amortized Fair of Fair Unrealized Unrealized
(In millions) Cost Value Value Gains Losses
Available-for-sale securities:
Investment-grade securities $ 30,165 $ 32,127 63.5% $ 2,341 $ 379
Below-investment-grade securities 1,275 1,086 2.1 6 195
Held-to-maturity securities:
Investment-grade securities 17,473 17,393 34.4 488 568
Total $ 48,913 $ 50,606 100.0% $ 2,835 $ 1,142
Aging of Unrealized Losses
Total Total Less Than Six Months Six Months to 12 Months Over 12 Months
Amortized Unrealized Amortized Unrealized Amortized Unrealized Amortized Unrealized
(In millions) Cost Loss Cost Loss Cost Loss Cost Loss
Available-for-sale securities:
Investment-grade securities $ 9,163 $ 379 $ 1,965 $ 17 $ 782 $ 19 $ 6,416 $ 343
Below-investment-grade securities 1,209 195 – – 16 – 1,193 195
Held-to-maturity securities:
Investment-grade securities 10,148 568 1,221 58 1,692 58 7,235 452
Total $ 20,520 $ 1,142 $ 3,186 $ 75 $ 2,490 $ 77 $ 14,844 $ 990
39
Percentage Decline From Amortized Cost
Total Total Less Than 20% 20% to 28%
Amortized Unrealized Amortized Unrealized Amortized Unrealized
(In millions) Cost Loss Cost Loss Cost Loss
Available-for-sale securities:
Investment-grade securities $ 9,163 $ 379 $ 9,104 $ 367 $ 59 $ 12
Below-investment-grade securities 1,209 195 643 61 566 134
Held-to-maturity securities:
Investment-grade securities 10,148 568 9,980 534 168 34
Total $ 20,520 $ 1,142 $ 19,727 $ 962 $ 793 $ 180