Aflac 2006 Annual Report Download - page 30
Download and view the complete annual report
Please find page 30 of the 2006 Aflac annual report below. You can navigate through the pages in the report by either clicking on the pages listed below, or by using the keyword search tool below to find specific information within the annual report.-
 1
1 -
2
-
3
-
4
-
5
-
6
-
7
-
8
-
9
-
10
-
11
-
12
-
13
-
14
-
15
-
16
-
17
-
18
-
19
-
 20
20 -
 21
21 -
 22
22 -
 23
23 -
 24
24 -
 25
25 -
 26
26 -
 27
27 -
 28
28 -
 29
29 -
 30
30 -
 31
31 -
 32
32 -
 33
33 -
 34
34 -
 35
35 -
 36
36 -
 37
37 -
 38
38 -
 39
39 -
 40
40 -
41
-
42
-
43
-
44
-
45
-
46
-
47
-
48
-
49
-
50
-
51
-
52
-
53
-
54
-
55
-
56
-
57
-
58
-
59
-
60
-
61
-
62
-
63
-
64
-
65
-
66
-
67
-
68
-
69
-
70
-
71
-
72
-
73
-
74
-
75
-
76
-
77
-
78
-
79
-
80
-
81
-
82
 |
 |

26
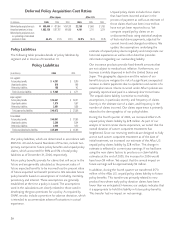
Policy Liabilities
The following table provides details of policy liabilities by
segment and in total as of December 31.
Our policy liabilities, which are determined in accordance with
SFAS No. 60 and Actuarial Standards of Practice, include two
primary components: future policy benefits and unpaid policy
claims, which accounted for 90% and 5% of total policy
liabilities as of December 31, 2006, respectively.
Future policy benefits provide for claims that will occur in the
future and are generally calculated as the present value of
future expected benefits to be incurred less the present value
of future expected net benefit premiums. We calculate future
policy benefits based on assumptions of morbidity, mortality,
persistency and interest. These assumptions are generally
established at the time a policy is issued. The assumptions
used in the calculations are closely related to those used in
developing the gross premiums for a policy. As required by
GAAP, we also include a provision for adverse deviation, which
is intended to accommodate adverse fluctuations in actual
experience.
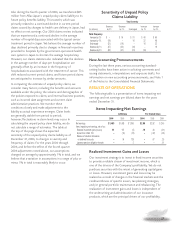
Unpaid policy claims include those claims
that have been incurred and are in the
process of payment as well as an estimate of
those claims that have been incurred but
have not yet been reported to us. We
compute unpaid policy claims on an
undiscounted basis using statistical analyses
of historical claims payments, adjusted for
current trends and changed conditions. We
update the assumptions underlying the
estimate of unpaid policy claims regularly and incorporate our
historical experience as well as other data that provides
information regarding our outstanding liability.
Our insurance products provide fixed-benefit amounts that
are not subject to medical-cost inflation. Furthermore, our
business is widely dispersed in both the United States and
Japan. This geographic dispersion and the nature of our
benefit structure mitigate the risk of a significant unexpected
increase in claims payments due to epidemics and events of a
catastrophic nature. Claims incurred under Aflac’s policies are
generally reported and paid in a relatively short time frame.
The unpaid claims liability is sensitive to morbidity
assumptions, in particular, severity and frequency of claims.
Severity is the ultimate size of a claim, and frequency is the
number of claims incurred. Our claims experience is primarily
related to the demographics of our policyholders.
During the fourth quarter of 2006, we increased Aflac’s U.S.
unpaid policy claims liability by $28 million. As part of our
analysis of recent cancer claims experience, we noted that the
overall duration of cancer outpatient treatments has
lengthened. Since our reserving methods are designed to fully
accrue each cancer outpatient treatment as of the date of
initial treatment, we increased our estimate of the Aflac U.S.
unpaid policy claims liability by $28 million. This change in
estimate is reflected in current year earnings. If we had been
using the new claims factors to produce our claim liability
estimates at the end of 2005, the increase for 2006 would
have been $9 million. We expect that the annual impact on
future earnings will be approximately $9 million.
In addition, during the fourth quarter we transferred $170
million of the Aflac U.S. unpaid policy claims liability to future
policy benefits. This transfer was primarily related to new
product lines where early policy duration claims have been
lower than we anticipated. However, our analysis indicates that
it is appropriate to hold this liability in future policy benefits.
This transfer had no impact on net earnings.
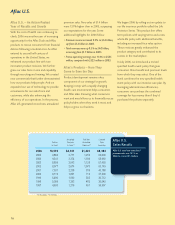
Policy Liabilities
(In millions)
2006 2005
U.S. segment:
Future policy benefits $ 4,391 $ 3,780
Unpaid policy claims 816 848
Other policy liabilities 158 143
Total U.S. policy liabilities $ 5,365 $ 4,771
Japan segment:
Future policy benefits $ 36,447 $ 34,071
Unpaid policy claims 1,574 1,657
Other policy liabilities 2,051 1,828
Total Japan policy liabilities $ 40,072 $ 37,556
Consolidated:
Future policy benefits $ 40,841 $ 37,853
Unpaid policy claims 2,390 2,504
Other policy liabilities 2,209 1,972
Total consolidated policy liabilities $ 45,440 $ 42,329
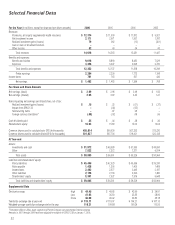
Deferred Policy Acquisition Cost Ratios
Aflac Japan Aflac U.S.
(In millions) 2006 2005 2004 2006 2005 2004
Deferred policy acquisition costs ¥ 459,404 ¥ 427,894 ¥ 397,261 $ 2,168 $ 1,966 $ 1,783
Annualized premiums in force 1,083,126 1,027,762 961,895 4,101 3,711 3,374
Deferred policy acquisition costs
as a percentage of annualized
premiums in force 42.4% 41.6% 41.3% 52.9% 53.0% 52.8%