Aflac 2006 Annual Report Download - page 7
Download and view the complete annual report
Please find page 7 of the 2006 Aflac annual report below. You can navigate through the pages in the report by either clicking on the pages listed below, or by using the keyword search tool below to find specific information within the annual report.-
 1
1 -
 2
2 -
 3
3 -
 4
4 -
 5
5 -
 6
6 -
 7
7 -
 8
8 -
 9
9 -
 10
10 -
 11
11 -
 12
12 -
 13
13 -
 14
14 -
 15
15 -
 16
16 -
 17
17 -
 18
18 -
19
-
20
-
21
-
22
-
23
-
24
-
25
-
26
-
27
-
28
-
29
-
30
-
31
-
32
-
33
-
34
-
35
-
36
-
37
-
38
-
39
-
40
-
41
-
42
-
43
-
44
-
45
-
46
-
47
-
48
-
49
-
50
-
51
-
52
-
53
-
54
-
55
-
56
-
57
-
58
-
59
-
60
-
61
-
62
-
63
-
64
-
65
-
66
-
67
-
68
-
69
-
70
-
71
-
72
-
73
-
74
-
75
-
76
-
77
-
78
-
79
-
80
-
81
-
82
 |
 |

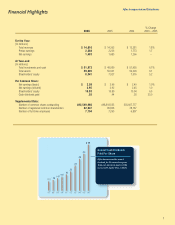
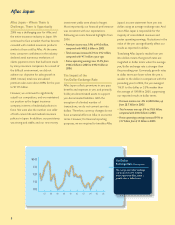
Net Earnings
Per Diluted Share
Net earnings per share reflected
record operating results, but lower
realized investment gains. Based on
the internal financial measure we use
to assess management’s
performance, which excludes items
that are either outside
management’s control or inherently
unpredictable, we achieved our
primary financial target in 2006.
97 98 99 00 01 02 03 04 05 06
1.04
.88
1.04
1.2 6 1.22
1.49 1.47
2.45
2.92 $2.95
Net Earnings Per Diluted Share
Internal Performance Measure
financial objective we use internally to assess
the growth of our business. We have
consistently defined that objective as the
growth of net earnings per diluted share,
excluding items that are inherently
unpredictable. We believe this objective is a
valuable measure for evaluating our
management and business performance.
And further, we believe that achieving our
objective is the primary driver of
shareholder value over the long term.
Another way we enhance shareholder value
is through dividends and our share
repurchase program. It has been our
objective to generally increase the cash
dividend in line with our internal
performance measure of earnings per share
growth. Reflecting a strong capital position
and confidence in our business model, we
raised the dividend twice in 2006. As a
result, cash dividends paid per share in 2006
were 25.0% higher than in 2005. We also
repurchased 10.3 million shares in 2006,
bringing the total number of shares we have
acquired since 1994 to more than 197
million. We believe that repurchasing Aflac
shares has proven to be a good use of excess
capital, and it has also enhanced our
per-share results.
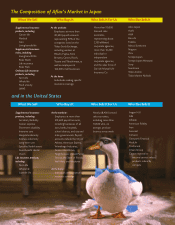
Aflac Japan – Adapting to a
Changing and Challenging Market
We have seen many changes in Japan’s
health care and insurance environment since
our entry in 1974. Health care costs have
steadily shifted to consumers for several
years as the country has tried to cope with
the effects of an aging population. That in
turn has led more insurance companies to
participate in the market for insurance
products like Aflac’s that pay “living
benefits” as opposed to more traditional
“death benefits.” As a result, we have seen a
more crowded market in recent years. Yet
despite the increase in competitors, we
believe we retain distinct strengths, including
our administrative efficiency, which allow us
to offer a very competitive product value to
consumers.
A major highlight in 2006 was the
introduction of WAYS, an innovative life
insurance product that gives consumers
significant flexibility by allowing them to
convert a portion of the policy’s death
benefits to either medical or nursing
coverage or annuity payments at retirement
age. The consumer response to WAYS led
to a strong year for our traditional life
insurance sales. However, due to weakness
in the medical product category, which
includes our EVER product line and Rider
MAX, total new sales declined for the year.
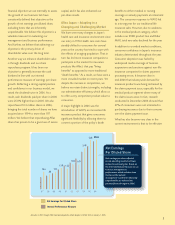
In addition to crowded market conditions,
consumer confidence in Japan’s insurance
industry deteriorated throughout the year.
Consumer skepticism was fueled by
widespread media coverage of business
suspensions and sanctions against non-life
insurance companies for claims payment
processing errors. It became clear in
mid-2006 that industrywide demand for
insurance products was being restrained by
the claims payment issue, especially for the
medical product segment where many of
the claims issues arose. In fact, research
conducted in December 2006 showed that
37% of consumers were not interested in
purchasing insurance due to their concerns
over the claims payment issue.
What has also become very clear in the
current environment is that to be effective
3
Amounts in 2001 through 2004 have been adjusted to reflect adoption of SFAS 123R on January 1, 2005.