Aflac 2006 Annual Report Download - page 73
Download and view the complete annual report
Please find page 73 of the 2006 Aflac annual report below. You can navigate through the pages in the report by either clicking on the pages listed below, or by using the keyword search tool below to find specific information within the annual report.-
 1
1 -
2
-
3
-
4
-
5
-
6
-
7
-
8
-
9
-
10
-
11
-
12
-
13
-
14
-
15
-
16
-
17
-
18
-
19
-
20
-
21
-
22
-
23
-
24
-
25
-
26
-
27
-
28
-
29
-
30
-
31
-
32
-
33
-
34
-
35
-
36
-
37
-
38
-
39
-
40
-
41
-
42
-
43
-
44
-
45
-
46
-
47
-
48
-
49
-
50
-
51
-
52
-
53
-
54
-
55
-
56
-
57
-
58
-
59
-
60
-
61
-
62
-
 63
63 -
 64
64 -
 65
65 -
 66
66 -
 67
67 -
 68
68 -
 69
69 -
 70
70 -
 71
71 -
 72
72 -
 73
73 -
 74
74 -
 75
75 -
 76
76 -
 77
77 -
 78
78 -
 79
79 -
 80
80 -
 81
81 -
 82
82
 |
 |

69
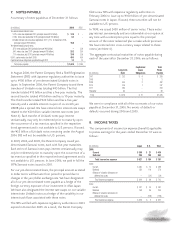
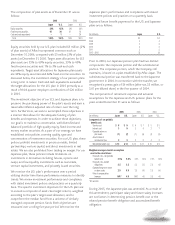
The composition of plan assets as of December 31 was as
follows:
2006 2005
Japan U.S. Japan U.S.
Equity securities 39% 65% 39% 56%
Fixed-income securities 61 34 61 18
Cash and cash equivalents –1–26
Total 100% 100% 100% 100%
Equity securities held by our U.S. plan included $3 million (2%
of plan assets) of Aflac Incorporated common stock at
December 31, 2006, compared with $3 million (3% of plan
assets) at December 31, 2005. Target asset allocations for U.S.
plan assets are 55% to 60% equity securities, 35% to 40%
fixed-income securities and 1% to 3% cash and cash
equivalents. Target asset allocations for Japanese plan assets
are 34% equity securities and 66% fixed-income securities. As
discussed below, the investment strategy of our pension plans
is long-term in nature. Cash and cash equivalents exceeded
the target allocations for the U.S. plan in 2005 primarily as a
result of third quarter employer contributions of $20 million
in 2005.
The investment objective of our U.S. and Japanese plans is to
preserve the purchasing power of the plan’s assets and earn a
reasonable inflation adjusted rate of return over the long
term. Furthermore, we seek to accomplish these objectives in
a manner that allows for the adequate funding of plan
benefits and expenses. In order to achieve these objectives,
our goal is to maintain a conservative, well-diversified and
balanced portfolio of high-quality equity, fixed-income and
money market securities. As a part of our strategy, we have
established strict policies covering quality, type and
concentration of investment securities. For our U.S. plan, these
policies prohibit investments in precious metals, limited
partnerships, venture capital, and direct investments in real
estate. We are also prohibited from trading on margin. For our
Japanese plan, these policies include limitations on
investments in derivatives including futures, options and
swaps, and low-liquidity investments such as real estate,
venture capital investments, and privately issued securities.
We monitor the U.S. plan’s performance over a period
utilizing shorter time frame performance measures to identify
trends. We review investment performance and compliance
with stated investment policies and practices on a quarterly
basis. The specific investment objectives for the U.S. plan are:
to exceed a composite of asset class target returns, weighted
according to the plan’s target asset allocation; and to
outperform the median fund from a universe of similarly
managed corporate pension funds. Both objectives are
measured over a rolling five-year period. We monitor the
Japanese plan’s performance and compliance with stated
investment policies and practices on a quarterly basis.
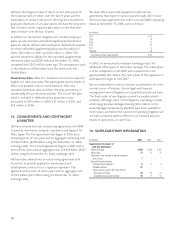
Expected future benefit payments for the U.S. and Japanese
plans are as follows:
(In millions) Japan U.S.
2007 $ 3 $ 4
2008 3 4
2009 3 4
2010 4 5
2011 3 5
2012 - 2016 23 34
Prior to 2004, our Japanese pension plan had two distinct
components: the corporate portion and the substitutional
portion. The corporate portion, which the Company still
maintains, is based on a plan established by Aflac Japan. The
substitutional portion was transferred back to the Japanese
government in 2004. In connection with the transfer, we
recognized a pretax gain of $6 million (after-tax, $3 million, or
$.01 per diluted share) in the first quarter of 2004.
The components of retirement expense and actuarial
assumptions for the Japanese and U.S. pension plans for the
years ended December 31 were as follows:
2006 2005 2004
(In millions) Japan U.S. Japan U.S. Japan U.S.
Components of net periodic
benefit cost:
Service cost $8 $9 $9 $7 $5 $5
Interest cost 393827
Expected return on
plan assets (1) (7) (1) (6) (1) (5)
Amortization of
net actuarial loss 23 2242
Net periodic benefit cost $ 12 $ 14 $13 $11 $ 10 $ 9
Weighted-average actuarial assumptions
used in the calculations:
Discount rate – net periodic
benefit cost 2.5% 5.5% 2.5% 6.0% 2.5% 6.5%
Discount rate – benefit
obligations 2.5 5.5 2.5 5.5 2.5 6.0
Expected long-term return
on plan assets 2.5 8.0 2.5 8.0 2.5 9.0
Rate of compensation
increase N/A* 4.0 N/A* 4.0 3.5 4.0
*Not applicable
During 2005, the Japanese plan was amended. As a result of
this amendment, participant salary and future salary increases
are not factors in determining pension benefit cost or the
related pension benefit obligation and accumulated benefit
obligation.