Aflac 2006 Annual Report Download - page 12
Download and view the complete annual report
Please find page 12 of the 2006 Aflac annual report below. You can navigate through the pages in the report by either clicking on the pages listed below, or by using the keyword search tool below to find specific information within the annual report.-
 1
1 -
 2
2 -
 3
3 -
 4
4 -
 5
5 -
 6
6 -
 7
7 -
 8
8 -
 9
9 -
 10
10 -
 11
11 -
 12
12 -
 13
13 -
 14
14 -
 15
15 -
 16
16 -
 17
17 -
 18
18 -
 19
19 -
 20
20 -
 21
21 -
 22
22 -
23
-
24
-
25
-
26
-
27
-
28
-
29
-
30
-
31
-
32
-
33
-
34
-
35
-
36
-
37
-
38
-
39
-
40
-
41
-
42
-
43
-
44
-
45
-
46
-
47
-
48
-
49
-
50
-
51
-
52
-
53
-
54
-
55
-
56
-
57
-
58
-
59
-
60
-
61
-
62
-
63
-
64
-
65
-
66
-
67
-
68
-
69
-
70
-
71
-
72
-
73
-
74
-
75
-
76
-
77
-
78
-
79
-
80
-
81
-
82
 |
 |

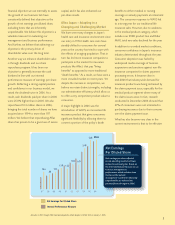
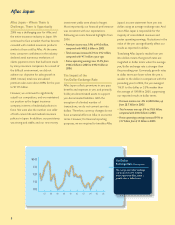
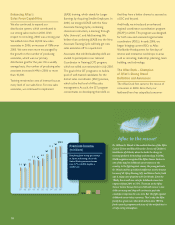
97 98 99 00 01 02 03 04 05 06
100
110
120
130
¥140
Yen/Dollar
Exchange Rate (Closing rates)
The average yen/dollar exchange
rate weakened 5.5% in 2006,
which suppressed Aflac Japan’s
growth rates in dollar terms.
Aflac Japan – Where There is
Challenge, There is Opportunity
2006 was a challenging year for Aflac and
the entire insurance industry in Japan. We
continued to face a market that has become
crowded with medical insurance products
similar to those sold by Aflac. At the same
time, consumer confidence in the industry
declined amid numerous revelations of
claims payment errors that had been made
by many insurance companies. As a result of
the difficult environment, we did not
achieve our objective for sales growth in
2006. Instead, total new annualized
premium sales were down 8.8% for the year
to ¥117.5 billion.
However, we continued to significantly
outsell our competitors, and we maintained
our position as the largest insurance
company in terms of individual policies in
force. We were also the number one seller
of both cancer life and medical insurance
policies in Japan. In addition, our persistency
was strong and stable, and our new money
investment yields were ahead of target.
Most importantly, our financial performance
was consistent with our expectations.
Following are some financial highlights from
2006:
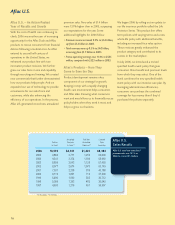
• Premium income rose 5.9% to ¥1.0 trillion,
compared with ¥962.6 billion in 2005.
• Total revenues increased 6.3% to ¥1.2 trillion,
compared with ¥1.1 trillion a year ago.
• Pretax operating earnings rose 15.4% from
¥166.4 billion in 2005 to ¥192.1 billion in
2006.
The Impact of the
Yen/Dollar Exchange Rate
Aflac Japan collects premiums in yen, pays
benefits and expenses in yen, and primarily
holds yen-denominated assets to support
yen-denominated liabilities. With the
exception of a limited number of
transactions, we do not convert yen into
dollars. Therefore, currency changes do not
have a material effect on Aflac in economic
terms. However, for financial reporting
purposes, we are required to translate Aflac
Japan’s income statement from yen into
dollars using an average exchange rate. And
since Aflac Japan is responsible for the
majority of consolidated revenues and
pretax operating earnings, fluctuations in the
value of the yen can significantly affect our
results as reported in dollars.
Translating Aflac Japan’s results from yen
into dollars means that growth rates are
magnified in dollar terms when the average
yen/dollar exchange rate is stronger than
the preceding year. Conversely, growth rates
in dollar terms are lower when the yen is
weaker to the dollar in comparison with the
preceding year. In 2006, the yen averaged
116.31 to the dollar, or 5.5% weaker than
the average of 109.88 in 2005, suppressing
our reported results in dollar terms.
• Premium income rose .2% to $8.8 billion, up
from $8.7 billion in 2005.
• Total revenues were up .6% to $10.5 billion,
compared with $10.4 billion in 2005.
• Pretax operating earnings increased 9.1% to
$1.7 billion from $1.5 billion in 2005.
Aflac Japan
8