Aflac 2006 Annual Report Download - page 62
Download and view the complete annual report
Please find page 62 of the 2006 Aflac annual report below. You can navigate through the pages in the report by either clicking on the pages listed below, or by using the keyword search tool below to find specific information within the annual report.-
 1
1 -
2
-
3
-
4
-
5
-
6
-
7
-
8
-
9
-
10
-
11
-
12
-
13
-
14
-
15
-
16
-
17
-
18
-
19
-
20
-
21
-
22
-
23
-
24
-
25
-
26
-
27
-
28
-
29
-
30
-
31
-
32
-
33
-
34
-
35
-
36
-
37
-
38
-
39
-
40
-
41
-
42
-
43
-
44
-
45
-
46
-
47
-
48
-
49
-
50
-
51
-
 52
52 -
 53
53 -
 54
54 -
 55
55 -
 56
56 -
 57
57 -
 58
58 -
 59
59 -
 60
60 -
 61
61 -
 62
62 -
 63
63 -
 64
64 -
 65
65 -
 66
66 -
 67
67 -
 68
68 -
 69
69 -
 70
70 -
 71
71 -
 72
72 -
73
-
74
-
75
-
76
-
77
-
78
-
79
-
80
-
81
-
82
 |
 |

58
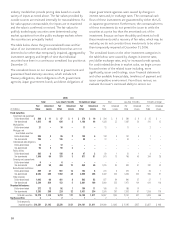
industry models that provide pricing data based on a wide
variety of inputs as noted above. The fair values provided by
outside sources are reviewed internally for reasonableness. If a
fair value appears unreasonable, the inputs are re-examined
and the value is confirmed or revised. The fair values for
publicly traded equity securities were determined using
market quotations from the public exchange markets where
the securities are principally traded.
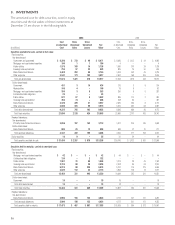
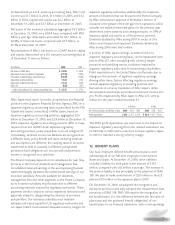
The table below shows the gross unrealized losses and fair
value of our investments with unrealized losses that are not
deemed to be other-than-temporarily impaired, aggregated by
investment category and length of time that individual
securities have been in a continuous unrealized loss position at
December 31.
The unrealized losses on our investments in government and
guaranteed fixed-maturity securities, which include U.S.
Treasury obligations, direct obligations of U.S. government
agencies, Japan government bonds, and direct obligations of
Japan government agencies were caused by changes in
interest rates and/or exchange rates. The contractual cash
flows of these investments are guaranteed by either the U.S.
or Japanese government. Furthermore, the contractual terms
of these investments do not permit the issuer to settle the
securities at a price less than the amortized cost of the
investment. Because we have the ability and intent to hold
these investments until a recovery of fair value, which may be
maturity, we do not consider these investments to be other-
than-temporarily impaired at December 31, 2006.
The unrealized losses on the other investment categories in
the table below were caused by changes in interest rates,
yen/dollar exchange rates, and/or increased credit spreads.
For credit related declines in market value, we begin a more
focused review of the related issuer including, more
significantly, issuer credit ratings, issuer financial statements
and other available financial data, timeliness of payment and
issuer competitive environment. From those reviews, we
evaluate the issuer's continued ability to service our
2006 2005
Total Less than 12 months 12 months or longer Total Less than 12 months 12 months or longer
Fair Unrealized Fair Unrealized Fair Unrealized Fair Unrealized Fair Unrealized Fair Unrealized
(In millions) Value Losses Value Losses Value Losses Value Losses Value Losses Value Losses
Fixed maturities:
Government and guaranteed:
Dollar-denominated $ 366 $ 11 $ 87 $ 1 $ 279 $ 10 $ 294 $ 6 $ 269 $ 6 $ 25 $ –
Yen-denominated 1,815 48 626 2 1,189 46 1,328 33 1,087 20 241 13
Municipalities:
Dollar-denominated 21 – 10 – 11 – 13 – 11 – 2 –
Mortgage- and
asset-backed securities:
Dollar-denominated 205 6 96 2 109 4 148 5 147 5 1 –
Yen-denominated 165 – 135 – 30 – 31 – 24 – 7 –
Collateralized debt obligations:
Dollar-denominated 10– 10– –– –– –– ––
Yen-denominated 902 902 –– –– –– ––
Public utilities:
Dollar-denominated 203 6 156 4 47 2 59 1 51 1 8 –
Yen-denominated 1,346 64 375 3 971 61 970 73 706 45 264 28
Sovereign and supranational:
Dollar-denominated 6– 6– –– –– –– ––
Yen-denominated 1,442 56 494 10 948 46 1,235 83 953 51 282 32
Banks/financial institutions:
Dollar-denominated 865 21 681 13 184 8 241 6 215 5 26 1
Yen-denominated 6,030 386 1,502 48 4,528 338 4,422 323 3,426 232 996 91
Other corporate:
Dollar-denominated 1,043 60 481 8 562 52 677 64 640 57 37 7
Yen-denominated 2,244 204 153 5 2,091 199 2,090 222 1,471 104 619 118
Perpetual debentures:
Dollar-denominated 272 12 92 1 180 11 189 10 189 10 – –
Yen-denominated 3,255 266 224 32 3,031 234 3,300 267 2,002 91 1,298 176
Total debt securities 19,378 1,142 5,218 131 14,160 1,011 14,997 1,093 11,191 627 3,806 466
Equity securities 3 – 2 – 1 – 2– 1– 1–
Total temporarily
impaired securities $19,381 $1,142 $5,220 $131 $14,161 $1,011 $14,999 $ 1,093 $ 11,192 $ 627 $ 3,807 $ 466