Aflac 2006 Annual Report Download - page 31
Download and view the complete annual report
Please find page 31 of the 2006 Aflac annual report below. You can navigate through the pages in the report by either clicking on the pages listed below, or by using the keyword search tool below to find specific information within the annual report.-
 1
1 -
2
-
3
-
4
-
5
-
6
-
7
-
8
-
9
-
10
-
11
-
12
-
13
-
14
-
15
-
16
-
17
-
18
-
19
-
20
-
 21
21 -
 22
22 -
 23
23 -
 24
24 -
 25
25 -
 26
26 -
 27
27 -
 28
28 -
 29
29 -
 30
30 -
 31
31 -
 32
32 -
 33
33 -
 34
34 -
 35
35 -
 36
36 -
 37
37 -
 38
38 -
 39
39 -
 40
40 -
 41
41 -
42
-
43
-
44
-
45
-
46
-
47
-
48
-
49
-
50
-
51
-
52
-
53
-
54
-
55
-
56
-
57
-
58
-
59
-
60
-
61
-
62
-
63
-
64
-
65
-
66
-
67
-
68
-
69
-
70
-
71
-
72
-
73
-
74
-
75
-
76
-
77
-
78
-
79
-
80
-
81
-
82
 |
 |

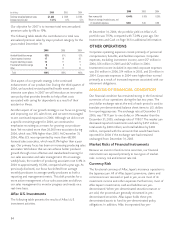
Also during the fourth quarter of 2006, we transferred $85
million from Aflac Japan’s unpaid policy claims liability to its
future policy benefits liability. This transfer, which was
primarily related to a continued decline in current period
claims caused by changes to health care delivery in Japan, had
no effect on net earnings. Our 2006 claims review indicated
that we experienced a continued decline in the average
number of hospital days associated with the typical cancer
treatment period in Japan. We believe the average number of
days declined primarily due to changes in financial incentives
provided to hospitals by the government-sponsored health
care system in Japan to shorten the average hospital stay.
However, our claims statistics also indicated that the declines
in the average number of days per hospitalization are
generally offset by an increase in the frequency of
hospitalizations associated with the treatment of cancer. This
shift reduced current period claims, and future period claims
are anticipated to increase by similar amounts.
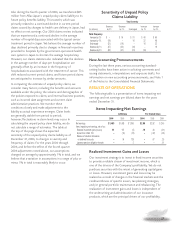
In computing the estimate of unpaid policy claims, we
consider many factors, including the benefits and amounts
available under the policy; the volume and demographics of
the policies exposed to claims; and internal business practices,
such as incurred date assignment and current claim
administrative practices. We monitor these
conditions closely and make adjustments to the
liability as actual experience emerges. Claim levels
are generally stable from period to period;
however, fluctuations in claim levels may occur. In
calculating the unpaid policy claim liability, we do
not calculate a range of estimates. The table at
the top of the page shows the expected
sensitivity of the unpaid policy claims liability as of
December 31, 2006, to changes in severity and
frequency of claims. For the years 2004 through
2006, and before the effect of the fourth quarter
2006 adjustments noted above, our assumptions
changed on average by approximately 1% in total, and we
believe that a variation in assumptions in a range of plus or
minus 1% in total is reasonably likely to occur.
New Accounting Pronouncements
During the last three years, various accounting standard-
setting bodies have been active in soliciting comments and
issuing statements, interpretations and exposure drafts. For
information on new accounting pronouncements, see Note 1
of the Notes to the Consolidated Financial Statements.
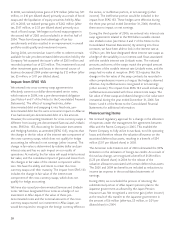
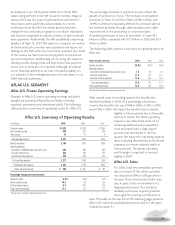
RESULTS OF OPERATIONS
The following table is a presentation of items impacting net
earnings and net earnings per diluted share for the years
ended December 31.
Realized Investment Gains and Losses
Our investment strategy is to invest in fixed-income securities
to provide a reliable stream of investment income, which is
one of the drivers of the Company’s profitability. We do not
purchase securities with the intent of generating capital gains
or losses. However, investment gains and losses may be
realized as a result of changes in the financial markets and the
creditworthiness of specific issuers, tax planning strategies,
and/or general portfolio maintenance and rebalancing. The
realization of investment gains and losses is independent of
the underwriting and administration of our insurance
products, which are the principal drivers of our profitability.
27
Sensitivity of Unpaid Policy
Claims Liability
Total Severity
Decrease Decrease Increase Increase
(In millions) by 2% by 1% Unchanged by 1% by 2%
Total Frequency
Increase by 2% $ – $ 16 $ 31 $ 48 $ 65
Increase by 1% (16) – 16 32 48
Unchanged (31) (16) – 16 32
Decrease by 1% (47) (32) (16) – 16
Decrease by 2% (62) (47) (31) (16) –
Items Impacting Net Earnings
In Millions Per Diluted Share
2006 2005 2004 2006 2005 2004
Net earnings $1,483 $1,483 $ 1,266 $2.95 $2.92 $ 2.45
Items impacting net earnings, net of tax:
Realized investment gains (losses) 51 167 (5) .10 .33 (.01)
Impact from SFAS 133 –(10) (13) –(.02) (.03)
Release of valuation allowance
on deferred tax assets –34 128 –.07 .25
Japanese pension obligation transfer ––3 –– .01