Aflac 2006 Annual Report Download - page 66
Download and view the complete annual report
Please find page 66 of the 2006 Aflac annual report below. You can navigate through the pages in the report by either clicking on the pages listed below, or by using the keyword search tool below to find specific information within the annual report.-
 1
1 -
2
-
3
-
4
-
5
-
6
-
7
-
8
-
9
-
10
-
11
-
12
-
13
-
14
-
15
-
16
-
17
-
18
-
19
-
20
-
21
-
22
-
23
-
24
-
25
-
26
-
27
-
28
-
29
-
30
-
31
-
32
-
33
-
34
-
35
-
36
-
37
-
38
-
39
-
40
-
41
-
42
-
43
-
44
-
45
-
46
-
47
-
48
-
49
-
50
-
51
-
52
-
53
-
54
-
55
-
 56
56 -
 57
57 -
 58
58 -
 59
59 -
 60
60 -
 61
61 -
 62
62 -
 63
63 -
 64
64 -
 65
65 -
 66
66 -
 67
67 -
 68
68 -
 69
69 -
 70
70 -
 71
71 -
 72
72 -
 73
73 -
 74
74 -
 75
75 -
 76
76 -
77
-
78
-
79
-
80
-
81
-
82
 |
 |

62
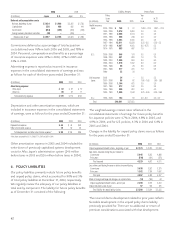
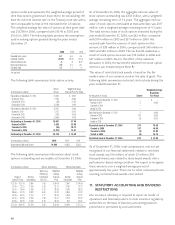
2006 2005
(In millions) Japan U.S. Japan U.S.
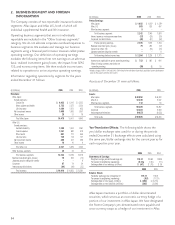
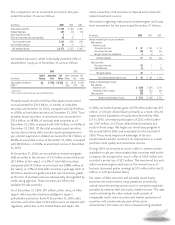
Deferred policy acquisition costs:
Balance, beginning of year $ 3,624 $ 1,966 $ 3,812 $ 1,783
Capitalization 556 492 562 441
Amortization (284) (290) (284) (258)
Foreign currency translation and other (39) – (466) –
Balance, end of year $ 3,857 $ 2,168 $ 3,624 $ 1,966
Commissions deferred as a percentage of total acquisition
costs deferred were 76% in both 2006 and 2005, and 78% in
2004. Personnel, compensation and benefits as a percentage
of insurance expenses were 44% in 2006, 41% in 2005 and
43% in 2004.
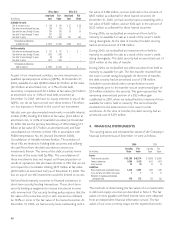
Advertising expense is reported as incurred in insurance
expenses in the consolidated statements of earnings and was
as follows for each of the three years ended December 31:
(In millions) 2006 2005 2004
Advertising expense:
Aflac Japan $82 $87 $70
Aflac U.S. 88 87 71
Total advertising expense $ 170 $ 174 $ 141
Depreciation and other amortization expenses, which are
included in insurance expenses in the consolidated statements
of earnings, were as follows for the years ended December 31:
(In millions) 2006 2005 2004
Depreciation expense $44 $44 $48
Other amortization expense 15 60 38
Total depreciation and other amortization expense* $59 $ 104 $ 86
*Aflac Japan accounted for $33 in 2006, $77 in 2005 and $60 in 2004.
Other amortization expense in 2005 and 2004 included the
write-down of previously capitalized systems development
costs for Aflac Japan’s administration system ($46 million
before taxes in 2005 and $26 million before taxes in 2004).
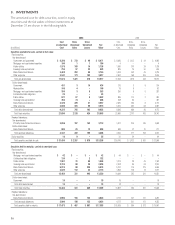
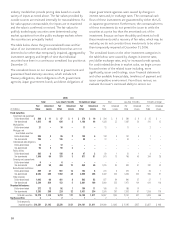
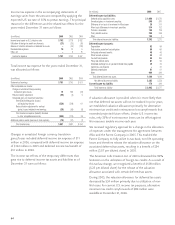
6. POLICY LIABILITIES
Our policy liabilities primarily include future policy benefits
and unpaid policy claims, which accounted for 90% and 5%
of total policy liabilities at December 31, 2006, respectively.
We regularly review the adequacy of our policy liabilities in
total and by component. The liability for future policy benefits
as of December 31 consisted of the following:
Liability Amounts Interest Rates
Policy Year
Issue of In 20
(In millions) Year 2006 2005 Issue Years
Health insurance:
Japan: 2005 - 2006 $ 148 $ 31 1.85% - 2.5% 1.85% - 2.5%
1999 - 2006 5,010 3,850 3.0 3.0
1997 - 1999 2,426 2,314 3.5 3.5
1995 - 1996 259 248 4.0 4.0
1994 - 1996 3,493 3,353 4.5 4.5
1987 - 1994 15,911 15,526 5.25 - 5.5 5.25 - 5.5
1978 - 1986 4,007 4,003 6.5 - 6.75 5.5
1974 - 1979 853 867 7.0 5.0
U.S.: 2005 - 2006 648 178 5.5 5.5
1998 - 2004 961 884 7.0 7.0
1988 - 2004 1,026 994 8.0 6.0
1986 - 2004 1,379 1,352 6.0 6.0
1985 - 1986 26 26 6.5 6.5
1981 - 1986 217 223 7.0 5.5
Other 33 36
Life insurance: 2006 24 – 2.5 2.5
Japan: 2001 - 2006 98 62 1.65 - 1.85 1.65 - 1.85
1999 - 2006 1,104 875 3.0 3.0
1997 - 1999 572 542 3.5 3.5
1994 - 1996 886 851 4.0 4.0
1985 - 1993 1,656 1,548 5.25 - 5.65 5.25 - 5.65
U.S.: 1956 - 2006 104 90 4.0 - 6.0 4.0 - 6.0
Total $ 40,841 $ 37,853
The weighted-average interest rates reflected in the
consolidated statements of earnings for future policy benefits
for Japanese policies were 4.7% in 2006, 4.8% in 2005, and
4.9% in 2004; and for U.S. policies, 6.3% in 2006 and 6.4% in
2005 and 2004.
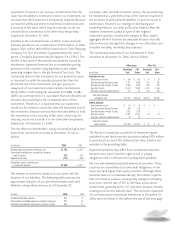
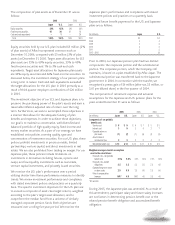
Changes in the liability for unpaid policy claims were as follows
for the years ended December 31:
(In millions) 2006 2005 2004
Unpaid supplemental health claims, beginning of year $ 2,375 $ 2,230 $ 2,008
Add claims incurred during the year related to:
Current year 5,045 5,203 4,886
Prior years (516) (401) (375)
Total incurred 4,529 4,802 4,511
Less claims paid during the year on claims incurred during:
Current year 3,435 3,352 3,270
Prior years 1,162 1,106 1,067
Total paid 4,597 4,458 4,337
Effect of foreign exchange rate changes on unpaid claims (14) (199) 48
Unpaid supplemental health claims, end of year 2,293 2,375 2,230
Unpaid life claims, end of year 97 129 125
Total liability for unpaid policy claims $ 2,390 $ 2,504 $ 2,355
The incurred claims development related to prior years reflects
favorable development in the unpaid policy claims liability
previously provided for. There are no additional or return of
premium considerations associated with that development.