Aflac 2006 Annual Report Download - page 37
Download and view the complete annual report
Please find page 37 of the 2006 Aflac annual report below. You can navigate through the pages in the report by either clicking on the pages listed below, or by using the keyword search tool below to find specific information within the annual report.-
 1
1 -
2
-
3
-
4
-
5
-
6
-
7
-
8
-
9
-
10
-
11
-
12
-
13
-
14
-
15
-
16
-
17
-
18
-
19
-
20
-
21
-
22
-
23
-
24
-
25
-
26
-
 27
27 -
 28
28 -
 29
29 -
 30
30 -
 31
31 -
 32
32 -
 33
33 -
 34
34 -
 35
35 -
 36
36 -
 37
37 -
 38
38 -
 39
39 -
 40
40 -
 41
41 -
 42
42 -
 43
43 -
 44
44 -
 45
45 -
 46
46 -
 47
47 -
48
-
49
-
50
-
51
-
52
-
53
-
54
-
55
-
56
-
57
-
58
-
59
-
60
-
61
-
62
-
63
-
64
-
65
-
66
-
67
-
68
-
69
-
70
-
71
-
72
-
73
-
74
-
75
-
76
-
77
-
78
-
79
-
80
-
81
-
82
 |
 |

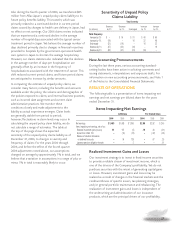
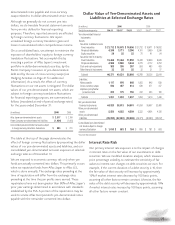
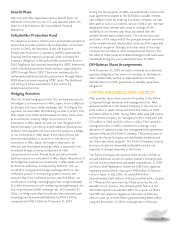
As disclosed in our third quarter 2006 Form 10-Q, Aflac
Japan, along with the entire life insurance industry, began a
review of the last five years of paid claims to determine if
those claims were paid fully and accurately. In a recent
notification from the FSA, the review process has been
changed from a voluntary program to one that is mandatory
and has been expanded to include a review of cash surrender
value payments. Additionally, the FSA established a reporting
deadline of April 13, 2007. We expect to complete our review
of claims and cash surrender value payments and report our
findings to the FSA within the time frame specified. As a result
of this review, we have found some payment errors and we
are correcting them. Additionally, we are using this review to
identify process changes that will help ensure that payment
errors such as these are not repeated. Although immaterial
to our financial statements, we have recorded a liability for
our estimate of the underpaid portion of those claims in our
2006 financial statements.
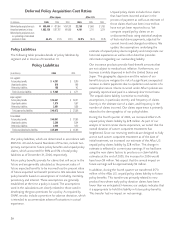
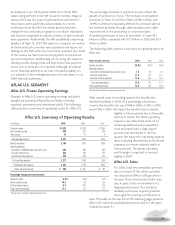
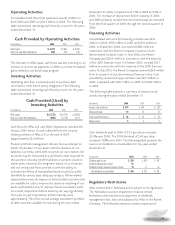
AFLAC U.S. SEGMENT
Aflac U.S. Pretax Operating Earnings
Changes in Aflac U.S. pretax operating earnings and profit
margins are primarily affected by morbidity, mortality,
expenses, persistency and investment yields. The following
table presents a summary of operating results for Aflac U.S.
The percentage increases in premium income reflect the
growth of premiums in force. The increases in annualized
premiums in force of 10.5% in 2006, 10.0% in 2005, and
10.9% in 2004 were favorably affected by increased sales at
the worksite primarily through cafeteria plans and a slight
improvement in the persistency of several products.
Annualized premiums in force at December 31 were $4.1
billion in 2006, compared with $3.7 billion in 2005 and $3.4
billion in 2004.
The following table presents a summary of operating ratios for
Aflac U.S.
After several years of trending upward, the benefit ratio
declined modestly in 2006. As a percentage of premium
income, the benefit ratio was 61.0% in 2006, 61.3% in 2005,
and 61.4% in 2004. We expect the benefit ratio to decline
slightly in future periods due to favorable
claim cost trends. The 2006 operating
expense ratio reflects the write-off of
remaining deferred policy acquisition
costs associated with a large payroll
account that terminated in the first
quarter. We expect the operating expense
ratio, excluding discretionary promotional
expenses, to remain relatively stable in
future periods. The pretax operating
profit margin is expected to increase
slightly in 2007.
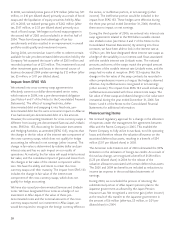
Aflac U.S. Sales
For 2006, total new annualized premium
sales increased 13.1%, which exceeded
our objective of 8% to 12% growth for
the year. These record sales results were
due, in part, to the re-enrollment of a
large payroll account. Our accident/
disability and cancer expense products
were again the primary contributors to
sales. The table on the top left of the following page presents
Aflac’s U.S. total new annualized premium sales for the years
ended December 31.
33
Aflac U.S. Summary of Operating Results
(In millions) 2006 2005
2004
Premium income $ 3,552 $ 3,245 $ 2,935
Net investment income 465 421 396
Other income 10 10 9
Total operating revenues 4,027 3,676 3,340
Benefits and claims 2,169 1,991 1,803
Operating expenses:
Amortization of deferred policy acquisition costs 290 258 245
Insurance commissions 444 410 371
Insurance and other expenses 539 492 424
Total operating expenses 1,273 1,160 1,040
Total benefits and expenses 3,442 3,151 2,843
Pretax operating earnings* $ 585 $ 525 $ 497
Percentage changes over previous year:
Premium income 9.5% 10.6% 13.1%
Net investment income 10.4 6.5 9.4
Total operating revenues 9.5 10.0 12.6
Pretax operating earnings* 11.4 5.6 11.7
*See Page 30 for our definition of segment operating earnings.
Ratios to total revenues: 2006 2005
2004
Benefits and claims 53.9% 54.2% 54.0%
Operating expenses:
Amortization of deferred policy acquisition costs 7.2 7.0 7.3
Insurance commissions 11.0 11.2 11.1
Insurance and other expenses 13.4 13.3 12.7
Total operating expenses 31.6 31.5 31.1
Pretax operating earnings* 14.5 14.3 14.9
*See Page 30 for our definition of segment operating earnings.