Aflac 2006 Annual Report Download - page 42
Download and view the complete annual report
Please find page 42 of the 2006 Aflac annual report below. You can navigate through the pages in the report by either clicking on the pages listed below, or by using the keyword search tool below to find specific information within the annual report.-
 1
1 -
2
-
3
-
4
-
5
-
6
-
7
-
8
-
9
-
10
-
11
-
12
-
13
-
14
-
15
-
16
-
17
-
18
-
19
-
20
-
21
-
22
-
23
-
24
-
25
-
26
-
27
-
28
-
29
-
30
-
31
-
 32
32 -
 33
33 -
 34
34 -
 35
35 -
 36
36 -
 37
37 -
 38
38 -
 39
39 -
 40
40 -
 41
41 -
 42
42 -
 43
43 -
 44
44 -
 45
45 -
 46
46 -
 47
47 -
 48
48 -
 49
49 -
 50
50 -
 51
51 -
 52
52 -
53
-
54
-
55
-
56
-
57
-
58
-
59
-
60
-
61
-
62
-
63
-
64
-
65
-
66
-
67
-
68
-
69
-
70
-
71
-
72
-
73
-
74
-
75
-
76
-
77
-
78
-
79
-
80
-
81
-
82
 |
 |

38
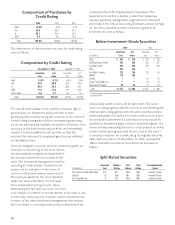
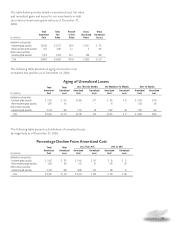
The distributions of debt securities we own, by credit rating,
were as follows:
The overall credit quality of our portfolio remained high in
part because our investment policy prohibits us from
purchasing below-investment-grade securities. In the event of
a credit rating downgrade to below-investment-grade status,
we do not automatically liquidate our position. However, if the
security is in the held-to-maturity portfolio, we immediately
transfer it to the available-for-sale portfolio so that the
security’s fair value and its unrealized gain/loss are reflected
on the balance sheet.
Once we designate a security as below investment grade, we
intensify our monitoring of the issuer. We do
not automatically recognize an impairment if
the security’s amortized cost exceeds its fair
value. Our investment management starts by
reviewing its credit analysis. Included in this
process are an evaluation of the issuer, its
current credit posture and an assessment of
the future prospects for the issuer. We then
obtain fair value information from at least
three independent pricing sources. Upon
determining the fair value, we move our focus
to an analysis of whether or not the decline in fair value, if any,
is other than temporary. For securities with an amortized cost
in excess of fair value, investment management then reviews
the issue based on our impairment policy to determine if the
investment should be impaired and/or liquidated. The
assessment of whether a decline is other than temporary
requires significant management judgment and is discussed
more fully in the Critical Accounting Estimates section on Page
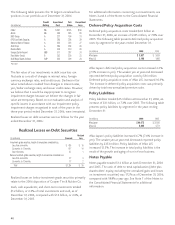
24. Securities classified as below investment grade as of
December 31 were as follows:
Occasionally a debt security will be split rated. This occurs
when one rating agency rates the security as investment grade
while another rating agency rates the same security as below
investment grade. Our policy is to review each issue on a case-
by-case basis to determine if a split-rated security should be
classified as investment grade or below investment grade. Our
review includes evaluating the issuer’s credit position as well as
current market pricing and other factors, such as the issuer’s
or security’s inclusion on a credit rating downgrade watch list.
Split-rated securities as of December 31, 2006, represented
.2% of total debt securities at amortized cost and were as
follows:
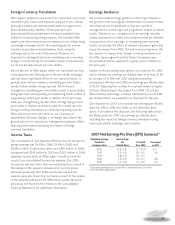
Composition of Purchases by
Credit Rating
2006 2005 2004
AAA 10.6% 6.1% 9.1%
AA 48.9 45.5 41.2
A35.1 42.9 36.7
BBB 5.4 5.5 13.0
Total 100.0% 100.0% 100.0%
Composition by Credit Rating
December 31, 2006 December 31, 2005
Amortized Fair Amortized Fair
Cost Value Cost Value
AAA 5.8% 5.7% 4.0% 3.9%
AA 35.0 35.8 33.7 34.9
A39.4 39.2 38.9 38.7
BBB 17.2 17.2 21.1 20.6
BB or lower 2.6 2.1 2.3 1.9
Total 100.0% 100.0% 100.0% 100.0%
Below-Investment-Grade Securities
2006 2005
Amortized Fair Amortized Fair
(In millions) Cost Value Cost Value
Ahold $ 300 $ 245 $ 302 $ 236
KLM Royal Dutch Airlines 252 229 254 227
Ford Motor Credit 252 229 254 209
CSAV 201 145 **
Ford Motor Company 122 100 123 84
BAWAG 118 103 **
LeGrand ** 46 52
Cooper Tire & Rubber Co. ** ** 45 45
Tennessee Gas Pipeline 30 35 31 33
Total $ 1,275 $ 1,086 $ 1,055 $ 886
*Investment grade at respective reporting date
**Sold during 2006
Split-Rated Securities
Amortized Moody’s S&P Fitch Investment-Grade
(In millions)
Cost Rating Rating Rating Status
Tyco Electronics AMP (AMP Japan) $ 50 Ba1 BBB+ BBB+ Investment Grade
LeGrand 46 Baa3 BB+ BBB- Investment Grade
Union Carbide Corp. 15 Ba2 BBB- BBB Investment Grade