Aflac 2006 Annual Report Download - page 70
Download and view the complete annual report
Please find page 70 of the 2006 Aflac annual report below. You can navigate through the pages in the report by either clicking on the pages listed below, or by using the keyword search tool below to find specific information within the annual report.-
 1
1 -
2
-
3
-
4
-
5
-
6
-
7
-
8
-
9
-
10
-
11
-
12
-
13
-
14
-
15
-
16
-
17
-
18
-
19
-
20
-
21
-
22
-
23
-
24
-
25
-
26
-
27
-
28
-
29
-
30
-
31
-
32
-
33
-
34
-
35
-
36
-
37
-
38
-
39
-
40
-
41
-
42
-
43
-
44
-
45
-
46
-
47
-
48
-
49
-
50
-
51
-
52
-
53
-
54
-
55
-
56
-
57
-
58
-
59
-
 60
60 -
 61
61 -
 62
62 -
 63
63 -
 64
64 -
 65
65 -
 66
66 -
 67
67 -
 68
68 -
 69
69 -
 70
70 -
 71
71 -
 72
72 -
 73
73 -
 74
74 -
 75
75 -
 76
76 -
 77
77 -
 78
78 -
 79
79 -
 80
80 -
81
-
82
 |
 |

66
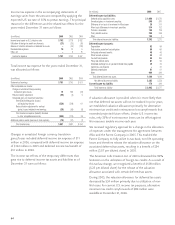
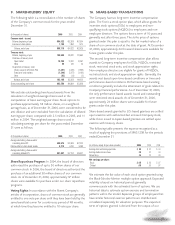
option model and represents the weighted-average period of
time that options granted are expected to be outstanding. We
base the risk-free interest rate on the Treasury note rate with a
term comparable to that of the estimated term of options.
The weighted-average fair value of options at their grant date
was $15.28 for 2006, compared with $13.40 in 2005 and
$10.66 in 2004. The following table presents the assumptions
used in valuing options granted during the years ended
December 31.
2006 2005 2004
Expected term (years) 6.7 6.6 4.9
Expected volatility 28.0% 28.0% 27.0%
Annual forfeiture rate .8 .8 N/A*
Risk-free interest rate 4.5 4.0 4.0
Dividend yield 1.1 1.1 .9
*Not applicable
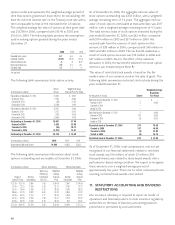
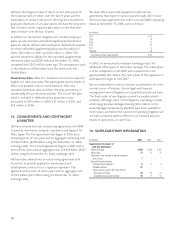
The following table summarizes stock option activity.
Option Weighted-Average
(In thousands of shares) Shares Exercise Price Per Share
Outstanding at December 31, 2003 21,636 $ 20.87
Granted in 2004 2,793 39.80
Canceled in 2004 (58) 31.25
Exercised in 2004 (2,284) 14.84
Outstanding at December 31, 2004 22,087 23.86
Granted in 2005 2,107 41.01
Canceled in 2005 (230) 35.36
Exercised in 2005 (3,983) 14.50
Outstanding at December 31, 2005 19,981 27.40
Granted in 2006 2,456 45.08
Canceled in 2006 (90) 39.72
Exercised in 2006 (2,241) 18.61
Outstanding at December 31, 2006 20,106 $ 30.48
(In thousands of shares) 2006 2005 2004
Shares exercisable, end of year 16,094 14,603 15,833
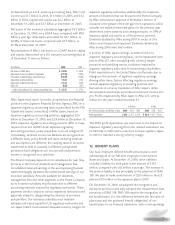
The following table summarizes information about stock
options outstanding and exercisable at December 31, 2006.
(In thousands of shares) Options Outstanding Options Exercisable
Wgtd.-Avg. Weighted- Weighted-
Remaining Average Average
Range of Number Contractual Exercise Number Exercise
Exercise Prices Outstanding Life (Yrs.) Price Exercisable Price
$ 12.38 – $21.16 2,990 1.65 $ 16.09 2,990 $ 16.09
21.48 – 23.23 3,780 3.26 23.12 3,780 23.12
23.41 – 29.66 3,245 4.23 26.54 3,245 26.54
29.68 – 31.75 2,882 6.05 31.22 2,865 31.22
32.09 – 40.03 2,134 7.77 38.24 1,008 37.72
40.30 – 43.38 2,535 7.88 41.21 1,702 40.42
43.66 – 49.15 2,540 9.19 45.35 504 43.67
$ 12.38 – $49.15 20,106 5.39 $ 30.48 16,094 $ 27.33
As of December 31, 2006, the aggregate intrinsic value of
stock options outstanding was $333 million, with a weighted-
average remaining term of 5.4 years. The aggregate intrinsic
value of stock options exercisable at that same date was $317
million, with a weighted-average remaining term of 4.5 years.
The total intrinsic value of stock options exercised during the
year ended December 31, 2006, was $62 million, compared
with $114 million in 2005 and $57 million in 2004. We
received cash from the exercise of stock options in the
amount of $38 million in 2006, compared with $49 million in
2005 and $32 million in 2004. The tax benefit realized as a
result of stock option exercises was $19 million in 2006 and
$37 million in 2005. Due to the effect of the valuation
allowance in 2004, the tax benefit realized from stock option
exercises was immaterial (see Note 8).
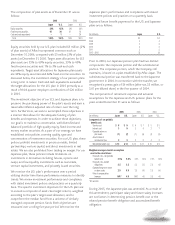
The value of restricted stock awards is based on the fair
market value of our common stock at the date of grant. The
following table summarizes restricted stock activity during the
years ended December 31.
Weighted-Average
Grant-Date
(In thousands of shares) Shares Fair Value
Restricted stock at December 31, 2003 – $ –
Granted in 2004 2 39.98
Canceled in 2004 – –
Vested in 2004 – –
Restricted stock at December 31, 2004 2 39.98
Granted in 2005 274 39.55
Canceled in 2005 (6) 38.75
Vested in 2005 – –
Restricted stock at December 31, 2005 270 39.58
Granted in 2006 357 46.96
Canceled in 2006 (8) 42.92
Vested in 2006 (6) 38.75
Restricted stock at December 31, 2006 613 $ 43.84
As of December 31, 2006, total compensation cost not yet
recognized in our financial statements related to restricted
stock awards was $16 million, of which $7 million (305
thousand shares) was related to share-based awards with a
performance-based vesting condition. We expect to recognize
these amounts over a weighted-average period of
approximately two years. There are no other contractual terms
covering restricted stock awards once vested.
11. STATUTORY ACCOUNTING AND DIVIDEND
RESTRICTIONS
Our insurance subsidiary is required to report its results of
operations and financial position to state insurance regulatory
authorities on the basis of statutory accounting practices
prescribed or permitted by such authorities.