Aflac 2006 Annual Report Download - page 52
Download and view the complete annual report
Please find page 52 of the 2006 Aflac annual report below. You can navigate through the pages in the report by either clicking on the pages listed below, or by using the keyword search tool below to find specific information within the annual report.-
 1
1 -
2
-
3
-
4
-
5
-
6
-
7
-
8
-
9
-
10
-
11
-
12
-
13
-
14
-
15
-
16
-
17
-
18
-
19
-
20
-
21
-
22
-
23
-
24
-
25
-
26
-
27
-
28
-
29
-
30
-
31
-
32
-
33
-
34
-
35
-
36
-
37
-
38
-
39
-
40
-
41
-
 42
42 -
 43
43 -
 44
44 -
 45
45 -
 46
46 -
 47
47 -
 48
48 -
 49
49 -
 50
50 -
 51
51 -
 52
52 -
 53
53 -
 54
54 -
 55
55 -
 56
56 -
 57
57 -
 58
58 -
 59
59 -
 60
60 -
 61
61 -
 62
62 -
63
-
64
-
65
-
66
-
67
-
68
-
69
-
70
-
71
-
72
-
73
-
74
-
75
-
76
-
77
-
78
-
79
-
80
-
81
-
82
 |
 |

48
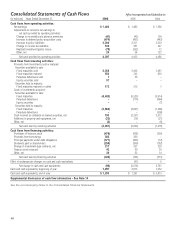
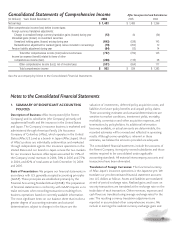
Consolidated Statements of Cash Flows Aflac Incorporated and Subsidiaries
(In millions) Years Ended December 31, 2006 2005 2004
Cash flows from operating activities:
Net earnings $ 1,483 $ 1,483 $ 1,266
Adjustments to reconcile net earnings to
net cash provided by operating activities:
Change in receivables and advance premiums (41) (43) 159
Increase in deferred policy acquisition costs (474) (461) (443)
Increase in policy liabilities 3,304 3,311 3,023
Change in income tax liabilities 180 351 347
Realized investment (gains) losses (79) (262) 12
Other, net 24 54 122
Net cash provided by operating activities 4,397 4,433 4,486
Cash flows from investing activities:
Proceeds from investments sold or matured:
Securities available for sale:
Fixed maturities sold 2,358 3,465 1,481
Fixed maturities matured 553 743 820
Perpetual debentures sold 135 –
Equity securities sold 57 ––
Securities held to maturity:
Fixed maturities matured or called 172 212 1
Costs of investments acquired:
Securities available for sale:
Fixed maturities (4,402) (5,523) (3,914)
Perpetual debentures –(710) (464)
Equity securities –– (1)
Securities held to maturity:
Fixed maturities (2,963) (2,661) (1,468)
Perpetual debentures –– (358)
Cash received as collateral on loaned securities, net 193 (2,237) 2,512
Additions to property and equipment, net (23) (16) (21)
Other, net (3) – (6)
Net cash used by investing activities (4,057) (6,692) (1,418)
Cash flows from financing activities:
Purchases of treasury stock (470) (438) (392)
Proceeds from borrowings 382 360 –
Principal payments under debt obligations (377) (269) (12)
Dividends paid to shareholders (258) (209) (182)
Change in investment-type contracts, net 217 257 220
Treasury stock reissued 42 50 39
Other, net 30 53 14
Net cash used by financing activities (434) (196) (313)
Effect of exchange rate changes on cash and cash equivalents –(61) 6
Net change in cash and cash equivalents (94) (2,516) 2,761
Cash and cash equivalents, beginning of year 1,297 3,813 1,052
Cash and cash equivalents, end of year $ 1,203 $ 1,297 $ 3,813
Supplemental disclosures of cash flow information - See Note 14
See the accompanying Notes to the Consolidated Financial Statements.