Aflac 2006 Annual Report Download - page 49
Download and view the complete annual report
Please find page 49 of the 2006 Aflac annual report below. You can navigate through the pages in the report by either clicking on the pages listed below, or by using the keyword search tool below to find specific information within the annual report.-
 1
1 -
2
-
3
-
4
-
5
-
6
-
7
-
8
-
9
-
10
-
11
-
12
-
13
-
14
-
15
-
16
-
17
-
18
-
19
-
20
-
21
-
22
-
23
-
24
-
25
-
26
-
27
-
28
-
29
-
30
-
31
-
32
-
33
-
34
-
35
-
36
-
37
-
38
-
 39
39 -
 40
40 -
 41
41 -
 42
42 -
 43
43 -
 44
44 -
 45
45 -
 46
46 -
 47
47 -
 48
48 -
 49
49 -
 50
50 -
 51
51 -
 52
52 -
 53
53 -
 54
54 -
 55
55 -
 56
56 -
 57
57 -
 58
58 -
 59
59 -
60
-
61
-
62
-
63
-
64
-
65
-
66
-
67
-
68
-
69
-
70
-
71
-
72
-
73
-
74
-
75
-
76
-
77
-
78
-
79
-
80
-
81
-
82
 |
 |

45
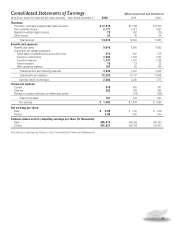
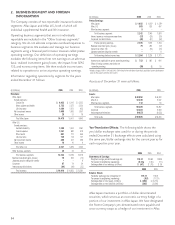
Consolidated Statements of Earnings Aflac Incorporated and Subsidiaries
(In millions, except for share and per-share amounts) Years Ended December 31, 2006 2005 2004
Revenues:
Premiums, principally supplemental health insurance $ 12,314 $11,990 $11,302
Net investment income 2,171 2,071 1,957
Realized investment gains (losses) 79 262 (12)
Other income 52 40 34
Total revenues 14,616 14,363 13,281
Benefits and expenses:
Benefits and claims 9,016 8,890 8,482
Acquisition and operating expenses:
Amortization of deferred policy acquisition costs 574 542 519
Insurance commissions 1,303 1,302 1,252
Insurance expenses 1,337 1,281 1,128
Interest expense 19 23 23
Other operating expenses 103 99 104
Total acquisition and operating expenses 3,336 3,247 3,026
Total benefits and expenses 12,352 12,137 11,508
Earnings before income taxes 2,264 2,226 1,773
Income tax expense:
Current 419 499 391
Deferred 362 278 244
Release of valuation allowance on deferred tax assets –(34) (128)
Total income taxes 781 743 507
Net earnings $ 1,483 $ 1,483 $ 1,266
Net earnings per share:
Basic $ 2.99 $ 2.96 $ 2.49
Diluted 2.95 2.92 2.45
Common shares used in computing earnings per share (In thousands):
Basic 495,614 500,939 507,333
Diluted 501,827 507,704 516,421
See the accompanying Notes to the Consolidated Financial Statements.