Aflac 2006 Annual Report Download - page 47
Download and view the complete annual report
Please find page 47 of the 2006 Aflac annual report below. You can navigate through the pages in the report by either clicking on the pages listed below, or by using the keyword search tool below to find specific information within the annual report.-
 1
1 -
2
-
3
-
4
-
5
-
6
-
7
-
8
-
9
-
10
-
11
-
12
-
13
-
14
-
15
-
16
-
17
-
18
-
19
-
20
-
21
-
22
-
23
-
24
-
25
-
26
-
27
-
28
-
29
-
30
-
31
-
32
-
33
-
34
-
35
-
36
-
 37
37 -
 38
38 -
 39
39 -
 40
40 -
 41
41 -
 42
42 -
 43
43 -
 44
44 -
 45
45 -
 46
46 -
 47
47 -
 48
48 -
 49
49 -
 50
50 -
 51
51 -
 52
52 -
 53
53 -
 54
54 -
 55
55 -
 56
56 -
 57
57 -
58
-
59
-
60
-
61
-
62
-
63
-
64
-
65
-
66
-
67
-
68
-
69
-
70
-
71
-
72
-
73
-
74
-
75
-
76
-
77
-
78
-
79
-
80
-
81
-
82
 |
 |

43
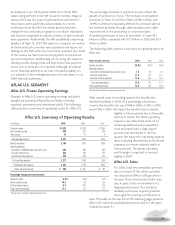
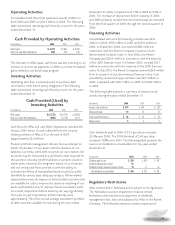
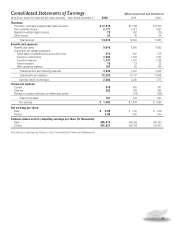
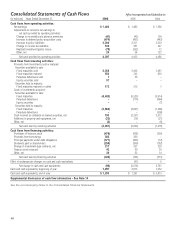
Operating Activities
Consolidated cash flow from operations was $4.4 billion in
both 2006 and 2005, and $4.5 billion in 2004. The following
table summarizes operating cash flows by source for the years
ended December 31.
The decrease in Aflac Japan cash flows was due primarily to an
increase in income tax payments in 2006 as a result of realized
gains related to our bond-swap program.
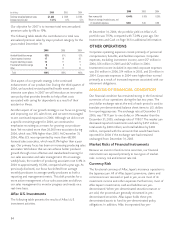
Investing Activities
Operating cash flow is primarily used to purchase debt
securities to meet future policy obligations. The following
table summarizes investing cash flows by source for the years
ended December 31.
Cash flows for Aflac U.S. and Other Operations included the
January 2005 return of cash collateral from the security
lending activities of Aflac U.S. at the end of 2004
(approximately $2.6 billion).
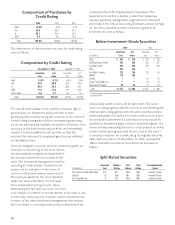
Prudent portfolio management dictates that we attempt to
match the duration of our assets with the duration of our
liabilities. Currently, when debt securities we own mature, the
proceeds may be reinvested at a yield below that required for
the accretion of policy benefit liabilities on policies issued in
earlier years. However, the long-term nature of our business
and our strong cash flows provide us with the ability to
minimize the effect of mismatched durations and/or yields
identified by various asset adequacy analyses. When market
opportunities arise, we dispose of selected debt securities that
are available for sale to improve the duration matching of our
assets and liabilities and/or improve future investment yields.
As a result, dispositions before maturity can vary significantly
from year to year. Dispositions before maturity were
approximately 7% of the annual average investment portfolio
of debt securities available for sale during the year ended
December 31, 2006, compared with 11% in 2005 and 5% in
2004. The increase of dispositions before maturity in 2006
and 2005 primarily resulted from the bond swaps we executed
from the third quarter of 2005 through the second quarter of
2006.
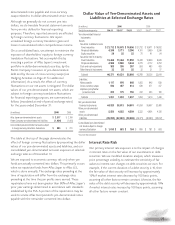
Financing Activities
Consolidated cash used by financing activities was $434
million in 2006, $196 million in 2005 and $313 million in
2004. In September 2006, we received $382 million in
connection with the Parent Company’s issuance of yen-
denominated Uridashi notes. In June 2006, the Parent
Company paid $355 million in connection with the maturity
of the 2001 Samurai notes. In October 2005, we paid $261
million in connection with the maturity of the 2000 Samurai
notes. In July 2005, the Parent Company received $360 million
from its issuance of yen-denominated Samurai notes. Cash
provided by investment-type contracts was $217 million in
2006, compared with $257 million in 2005 and $220 million
in 2004.
The following table presents a summary of treasury stock
activity during the years ended December 31.
Cash dividends paid in 2006 of $.55 per share increased
25.0% over 2005. The 2005 dividend of $.44 per share
increased 15.8% over 2004. The following table presents the
sources of dividends to shareholders for the years ended
December 31.
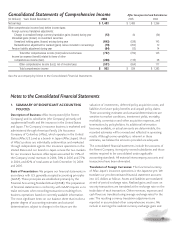
Regulatory Restrictions
Aflac is domiciled in Nebraska and is subject to its regulations.
The Nebraska insurance department imposes certain
limitations and restrictions on payments of dividends,
management fees, loans and advances by Aflac to the Parent
Company. The Nebraska insurance statutes require prior
Cash Provided by Operating Activities
(In millions)
2006 2005
2004
Aflac Japan $ 3,437 $ 3,691 $ 3,670
Aflac U.S. and Other Operations 960 742 816
Cash Provided (Used) by
Investing Activities
(In millions)
2006 2005
2004
Aflac Japan $ (3,372) $ (3,574) $ (3,692)
Aflac U.S. and Other Operations (685) (3,118) 2,274
(In millions) 2006 2005
2004
Treasury stock purchases $ 470 $ 438 $ 392
Shares purchased 10 10 10
Stock issued from treasury $42 $50 $39
Shares issued 343
(In millions) 2006 2005
2004
Dividends paid in cash $ 258 $ 209 $ 182
Dividends declared but not paid 91 ––
Dividends through issuance of treasury shares 15 11 10
Total dividends to shareholders $ 364 $ 220 $ 192