Aflac 2006 Annual Report Download - page 20
Download and view the complete annual report
Please find page 20 of the 2006 Aflac annual report below. You can navigate through the pages in the report by either clicking on the pages listed below, or by using the keyword search tool below to find specific information within the annual report.-
 1
1 -
2
-
3
-
4
-
5
-
6
-
7
-
8
-
9
-
 10
10 -
 11
11 -
 12
12 -
 13
13 -
 14
14 -
 15
15 -
 16
16 -
 17
17 -
 18
18 -
 19
19 -
 20
20 -
 21
21 -
 22
22 -
 23
23 -
 24
24 -
 25
25 -
 26
26 -
 27
27 -
 28
28 -
 29
29 -
 30
30 -
31
-
32
-
33
-
34
-
35
-
36
-
37
-
38
-
39
-
40
-
41
-
42
-
43
-
44
-
45
-
46
-
47
-
48
-
49
-
50
-
51
-
52
-
53
-
54
-
55
-
56
-
57
-
58
-
59
-
60
-
61
-
62
-
63
-
64
-
65
-
66
-
67
-
68
-
69
-
70
-
71
-
72
-
73
-
74
-
75
-
76
-
77
-
78
-
79
-
80
-
81
-
82
 |
 |

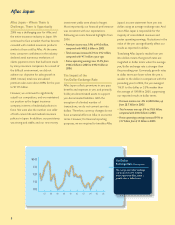
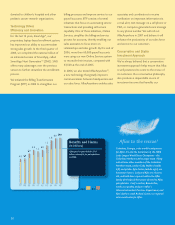
Aflac U.S.
Sales Results
Aflac U.S. total new annualized
premium sales rose 13.1% in
2006 to a record $1.4 billion.
Aflac U.S.
Aflac U.S. – An Action-Packed
Year of Results and Growth
With the cost of health care continuing to
climb, 2006 was another year of increasing
opportunity for the Aflac Duck and Aflac
products to rescue consumers from financial
distress following a medical crisis. As Aflac
entered its second half-century of
operations in the United States, we
enhanced our product line with two
innovative product revisions. We further
grew our sales force in size and capability
through recruiting and training. We created
new commercials that further demonstrated
how our products help people. And we
expanded our use of technology to provide
convenience for our sales force and
customers, while also enhancing the
efficiency of our operations. In the process,
Aflac U.S. generated record new annualized
premium sales. New sales of $1.4 billion
were 13.1% higher than in 2005, surpassing
our expectations for the year. Some
additional highlights for 2006 follow:
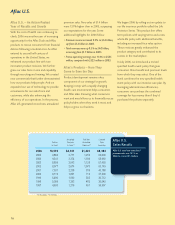
• Premium income increased 9.5% to $3.6 billion,
up from $3.2 billion in 2005.
• Total revenues were up 9.5% to $4.0 billion,
increasing from $3.7 billion in 2005.
• Pretax operating earnings rose 11.4% to $585
million, compared with $525 million in 2005.
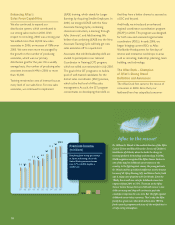
Aflac’s Products – Here They
Come to Save the Day
Product development remains a key
component of our strategy for growth.
Keeping in step with a rapidly changing
health care environment helps consumers
and Aflac alike. Knowing what consumers
want and need allows us to financially rescue
policyholders when they need it most, and
helps us grow our business.
We began 2006 by rolling out an update to
our life insurance portfolio called the Life
Protector Series. This product line offers
term policies with varying terms and a new
whole-life policy with additional benefits,
including an increased face value option.
These revisions greatly enhanced the
product category and contributed to its
success in the marketplace.
In July 2006, we introduced a revised
specified health event policy that gives
consumers three benefit and premium levels
from which they may select. One of the
levels combines the new specified health
event policy with our intensive care plan. By
leveraging administrative efficiencies,
consumers can purchase the combined
coverage for less money than if they’d
purchased the policies separately.
16
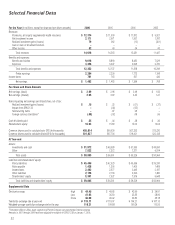
Annualized Total New Licensed
Policies Premiums Annualized Sales
In Force* In Force** Premiums** Associates
2006 10,519 $4,101 $1,423 68,394
2005 9,884 3,711 1,259 63,008
2004 9,341 3,374 1,186 58,992
2003 8,805 3,043 1,128 57,493
2002 8,077 2,674 1,070 53,149
2001 7,031 2,238 919 43,188
2000 6,119 1,861 712 37,509
1999 5,480 1,592 555 30,712
1998 5,056 1,393 482 30,045
1997 4,693 1,216 401 35,997
*In thousands **In millions