Aflac 2006 Annual Report Download - page 34
Download and view the complete annual report
Please find page 34 of the 2006 Aflac annual report below. You can navigate through the pages in the report by either clicking on the pages listed below, or by using the keyword search tool below to find specific information within the annual report.-
 1
1 -
2
-
3
-
4
-
5
-
6
-
7
-
8
-
9
-
10
-
11
-
12
-
13
-
14
-
15
-
16
-
17
-
18
-
19
-
20
-
21
-
22
-
23
-
 24
24 -
 25
25 -
 26
26 -
 27
27 -
 28
28 -
 29
29 -
 30
30 -
 31
31 -
 32
32 -
 33
33 -
 34
34 -
 35
35 -
 36
36 -
 37
37 -
 38
38 -
 39
39 -
 40
40 -
 41
41 -
 42
42 -
 43
43 -
 44
44 -
45
-
46
-
47
-
48
-
49
-
50
-
51
-
52
-
53
-
54
-
55
-
56
-
57
-
58
-
59
-
60
-
61
-
62
-
63
-
64
-
65
-
66
-
67
-
68
-
69
-
70
-
71
-
72
-
73
-
74
-
75
-
76
-
77
-
78
-
79
-
80
-
81
-
82
 |
 |

30
INSURANCE OPERATIONS
Aflac’s insurance business consists of two
segments: Aflac Japan and Aflac U.S. Aflac
Japan, which operates as a branch of
Aflac, is the principal contributor to
consolidated earnings. GAAP financial
reporting requires that a company report
financial and descriptive information
about operating segments in its annual
financial statements. Furthermore, we are
required to report a measure of segment
profit or loss, certain revenue and expense
items, and segment assets.
We measure and evaluate our insurance
segments’ financial performance using
operating earnings on a pretax basis. We
define segment operating earnings as the
profits we derive from our operations
before realized investment gains and
losses, the impact from SFAS 133, and
nonrecurring items. We believe that an
analysis of segment pretax operating
earnings is vitally important to an
understanding of the underlying
profitability drivers and trends of our
insurance business. Furthermore, because
a significant portion of our business is conducted in Japan, we
believe it is equally important to understand the impact of
translating Japanese yen into U.S. dollars.
We evaluate our sales efforts using new annualized premium
sales, an industry operating measure. Total new annualized
premium sales, which include new sales and the incremental
increase in premiums due to conversions, represent the
premiums that we would collect over a 12-month period,
assuming the policies remain in force. Premium income, or
earned premiums, is a financial performance measure that
reflects collected or due premiums that have been earned
ratably on policies in force during the reporting period.
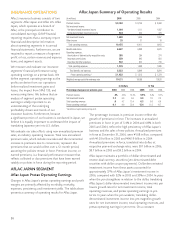
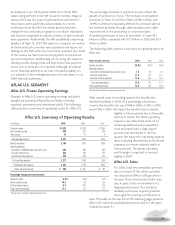
AFLAC JAPAN SEGMENT
Aflac Japan Pretax Operating Earnings
Changes in Aflac Japan’s pretax operating earnings and profit
margins are primarily affected by morbidity, mortality,
expenses, persistency, and investment yields. The table above
presents a summary of operating results for Aflac Japan.
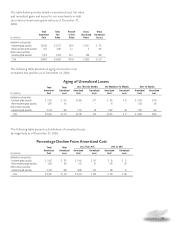
The percentage increases in premium income reflect the
growth of premiums in force. The increases in annualized
premiums in force in yen of 5.4% in 2006 and 6.8% in both
2005 and 2004, reflect the high persistency of Aflac Japan’s
business and the sales of new policies. Annualized premiums
in force at December 31, 2006, were ¥1.08 trillion, compared
with ¥1.03 trillion in 2005 and ¥961.9 billion in 2004.
Annualized premiums in force, translated into dollars at
respective year-end exchange rates, were $9.1 billion in 2006,
$8.7 billion in 2005 and $9.2 billion in 2004.
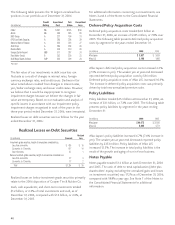
Aflac Japan maintains a portfolio of dollar-denominated and
reverse-dual currency securities (yen-denominated debt
securities with dollar coupon payments). Dollar-denominated
investment income from these assets accounted for
approximately 37% of Aflac Japan’s investment income in
2006, compared with 32% in 2005 and 30% in 2004. In years
when the yen strengthens in relation to the dollar, translating
Aflac Japan’s dollar-denominated investment income into yen
lowers growth rates for net investment income, total
operating revenues, and pretax operating earnings in yen
terms. In years when the yen weakens, translating dollar-
denominated investment income into yen magnifies growth
rates for net investment income, total operating revenues, and
pretax operating earnings in yen terms. On a constant
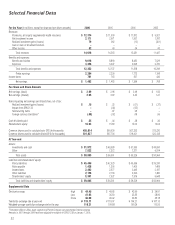
Aflac Japan Summary of Operating Results
(In millions) 2006 2005 2004
Premium income $ 8,762 $ 8,745 $ 8,368
Net investment income:
Yen-denominated investment income 1,064 1,111 1,087
Dollar-denominated investment income 624 524 470
Net investment income 1,688 1,635 1,557
Other income 25 31 18
Total operating revenues 10,475 10,411 9,943
Benefits and claims 6,847 6,898 6,679
Operating expenses:
Amortization of deferred policy acquisition costs 285 284 274
Insurance commissions 859 892 881
Insurance and other expenses 832 822 730
Total operating expenses 1,976 1,998 1,885
Total benefits and expenses 8,823 8,896 8,564
Pretax operating earnings* $ 1,652 $ 1,515 $ 1,379
Weighted-average yen/dollar exchange rate 116.31 109.88 108.26
In Dollars In Yen
Percentage changes over previous year: 2006 2005 2004 2006 2005 2004
Premium income .2% 4.5% 14.2% 5.9% 6.3% 6.7%
Net investment income 3.2 5.0 9.6 9.0 7.0 2.3
Total operating revenues .6 4.7 13.4 6.3 6.6 6.0
Pretax operating earnings* 9.1 9.9 22.9 15.4 11.5 14.7
*See definition of segment operating earnings to left.