Aflac 2006 Annual Report Download - page 64
Download and view the complete annual report
Please find page 64 of the 2006 Aflac annual report below. You can navigate through the pages in the report by either clicking on the pages listed below, or by using the keyword search tool below to find specific information within the annual report.
60
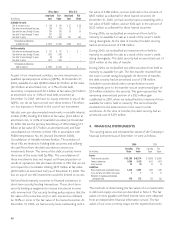
Aflac Japan Aflac U.S.
Amortized Fair Amortized Fair
(In millions) Cost Value Cost Value
Available for sale:
Due in one year or less $ 108 $ 109 $ 57 $ 58
Due after one year through five years 296 316 15 17
Due after five years through 10 years 294 393 35 35
Due after 10 years through 15 years 257 235 – –
Due after 15 years 2,918 2,882 361 363
Total perpetual debentures
available for sale $ 3,873 $ 3,935 $ 468 $ 473
Held to maturity:
Due after one year through five years $ 727 $ 751 $ – $ –
Due after five years through 10 years 1,600 1,682 – –
Due after 10 years through 15 years 86 88 – –
Due after 15 years 1,577 1,503 – –
Total perpetual debentures
held to maturity $ 3,990 $ 4,024 $ – $ –
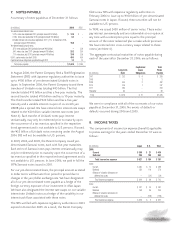
As part of our investment activities, we own investments in
qualified special purpose entities (QSPEs). At December 31,
2006, available-for-sale QSPEs totaled $2.3 billion at fair value
($2.3 billion at amortized cost, or 4.7% of total debt
securities), compared with $2.2 billion at fair value ($2.3 billion
at amortized cost, or 5.0% of total debt securities) at
December 31, 2005. We have no equity interests in any of the
QSPEs, nor do we have control over these entities. Therefore,
our loss exposure is limited to the cost of our investment.
We also own yen-denominated investments in variable interest
entities (VIEs) totaling $1.9 billion at fair value, ($2.0 billion at
amortized cost, or 4.2% of total debt securities) at December
31, 2006. We are the primary beneficiary of VIEs totaling $1.5
billion at fair value ($1.7 billion at amortized cost) and have
consolidated our interests in these VIEs in accordance with
FASB Interpretation No. 46 (revised December 2003),
Consolidation of Variable Interest Entities. The activities of
these VIEs are limited to holding debt securities and utilizing
the cash flows from the debt securities to service our
investments therein. The terms of the debt securities mirror
the terms of the notes held by Aflac. The consolidation of
these investments does not impact our financial position or
results of operations. We also have interests in VIEs that we are
not required to consolidate totaling $375 million at fair value
($373 million at amortized cost) as of December 31, 2006. The
loss on any of our VIE investments would be limited to its cost.
We lend fixed-maturity securities to financial institutions in
short-term security lending transactions. These short-term
security lending arrangements increase investment income
with minimal risk. Our security lending policy requires that the
fair value of the securities and/or cash received as collateral
be 102% or more of the fair value of the loaned securities. At
December 31, 2006, we had security loans outstanding with a
fair value of $780 million, and we held cash in the amount of
$807 million as collateral for these loaned securities. At
December 31, 2005, we had security loans outstanding with a
fair value of $605 million, and we held cash in the amount of
$622 million as collateral for these loaned securities.
During 2006, we reclassified an investment from held to
maturity to available for sale as a result of the issuer’s credit
rating downgrade. At the date of transfer, this debt security
had an amortized cost of $118 million.
During 2005, we reclassified an investment from held to
maturity to available for sale as a result of the issuer’s credit
rating downgrade. This debt security had an amortized cost of
$254 million at the date of transfer.
During 2004, we reclassified two debt securities from held to
maturity to available for sale. The first transfer resulted from
the issuer’s credit rating downgrade. At the time of transfer,
the debt security had an amortized cost of $118 million.
Included in accumulated other comprehensive income
immediately prior to the transfer was an unamortized gain of
$24 million related to this security. This gain represented the
remaining unamortized portion of a $32 million gain
established in 2001, when we reclassified this investment from
available for sale to held to maturity. The second transfer
resulted from the deterioration in the issuer’s credit
worthiness. At the time of transfer, this debt security had an
amortized cost of $291 million.
4. FINANCIAL INSTRUMENTS
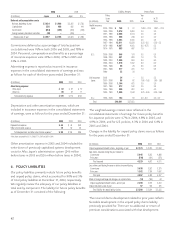
The carrying values and estimated fair values of the Company’s
financial instruments as of December 31 were as follows:
2006 2005
Carrying Fair Carrying Fair
(In millions) Value Value Value Value
Assets:
Fixed-maturity securities $ 42,288 $ 42,174 $ 39,009 $ 38,981
Perpetual debentures 8,398 8,432 8,542 8,622
Equity securities 25 25 84 84
Liabilities:
Notes payable (excl. capitalized leases) 1,416 1,421 1,382 1,395
Cross-currency and interest rate swaps 77 12 12
Obligation to Japanese policyholder
protection fund 175 175 203 203
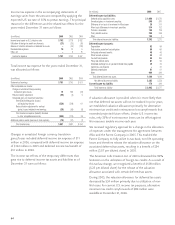
The methods of determining the fair values of our investments
in debt and equity securities are described in Note 3. The fair
values of notes payable with fixed interest rates were obtained
from an independent financial information service. The fair
values of our cross-currency swaps are the expected amounts


