Aflac 2006 Annual Report Download - page 61
Download and view the complete annual report
Please find page 61 of the 2006 Aflac annual report below. You can navigate through the pages in the report by either clicking on the pages listed below, or by using the keyword search tool below to find specific information within the annual report.-
 1
1 -
2
-
3
-
4
-
5
-
6
-
7
-
8
-
9
-
10
-
11
-
12
-
13
-
14
-
15
-
16
-
17
-
18
-
19
-
20
-
21
-
22
-
23
-
24
-
25
-
26
-
27
-
28
-
29
-
30
-
31
-
32
-
33
-
34
-
35
-
36
-
37
-
38
-
39
-
40
-
41
-
42
-
43
-
44
-
45
-
46
-
47
-
48
-
49
-
50
-
 51
51 -
 52
52 -
 53
53 -
 54
54 -
 55
55 -
 56
56 -
 57
57 -
 58
58 -
 59
59 -
 60
60 -
 61
61 -
 62
62 -
 63
63 -
 64
64 -
 65
65 -
 66
66 -
 67
67 -
 68
68 -
 69
69 -
 70
70 -
 71
71 -
72
-
73
-
74
-
75
-
76
-
77
-
78
-
79
-
80
-
81
-
82
 |
 |

57
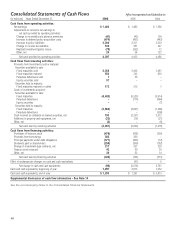
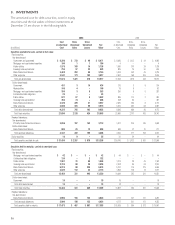
The components of net investment income for the years
ended December 31 were as follows:
(In millions) 2006 2005 2004
Fixed-maturity securities $ 1,782 $ 1,693 $ 1,621
Perpetual debentures 387 378 349
Equity securities and other 211
Short-term investments and cash equivalents 20 20 7
Gross investment income 2,191 2,092 1,978
Less investment expenses 20 21 21
Net investment income $ 2,171 $ 2,071 $ 1,957
Investment exposures, which individually exceeded 10% of
shareholders’ equity as of December 31, were as follows:
2006 2005
Credit Amortized Fair Credit Amortized Fair
(In millions) Rating Cost Value Rating Cost Value
Japan National Government AA $ 7,849 $ 8,536 AA $ 8,178 $ 9,167
HSBC** ***AA/A 784* 850
*Less than 10%
**For this issuer, we own more than one security with different ratings.
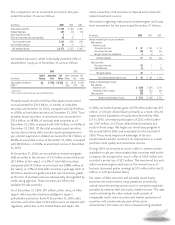
Privately issued securities held by Aflac Japan at amortized
cost accounted for $31.3 billion, or 64.0%, of total debt
securities at December 31, 2006, compared with $27.9 billion,
or 61.8%, of total debt securities at December 31, 2005. Total
privately issued securities, at amortized cost, accounted for
$33.6 billion, or 68.8%, of our total debt securities as of
December 31, 2006, compared with $30.1 billion, or 66.6%, at
December 31, 2005. Of the total privately issued securities,
reverse-dual currency debt securities (principal payments in
yen, interest payments in dollars) accounted for $9.7 billion, or
28.9%, at amortized cost as of December 31, 2006, compared
with $8.9 billion, or 29.6%, at amortized cost as of December
31, 2005.
At December 31, 2006, we owned below-investment-grade
debt securities in the amount of $1.3 billion at amortized cost
($1.1 billion at fair value), or 2.6% of total debt securities,
compared with $1.1 billion at amortized cost ($886 million at
fair value), or 2.3% of total debt securities a year ago. Each of
the below-investment-grade securities was investment grade
at the time of purchase and was subsequently downgraded by
credit rating agencies. These securities are held in the
available-for-sale portfolio.
As of December 31, 2006, $91 million, at fair value, of Aflac
Japan’s debt securities had been pledged to Japan’s
policyholder protection fund. At December 31, 2006, debt
securities with a fair value of $13 million were on deposit with
regulatory authorities in the United States and Japan. We
retain ownership of all securities on deposit and receive the
related investment income.
Information regarding realized and unrealized gains and losses
from investments for the years ended December 31 follows:
(In millions) 2006 2005 2004
Realized investment gains (losses) on securities:
Debt securities:
Available for sale:
Gross gains from sales $ 67 $ 284 $ 36
Gross losses from sales (34) (22) (54)
Net gains (losses) from redemptions 4(1) 6
Total debt securities 37 261 (12)
Equity securities:
Gross gains from sales 43 11
Impairment losses (1) – (1)
Total equity securities 42 1–
Total realized investment gains (losses) $ 79 $ 262 $ (12)
Changes in unrealized gains (losses):
Debt securities:
Available for sale $ (624) $ (697) $ 216
Transferred to held to maturity (52) (113) (64)
Equity securities (45) 11 4
Change in unrealized gains (losses) $ (721) $ (799) $ 156
In 2006, we realized pretax gains of $79 million (after-tax, $51
million, or $.10 per diluted share) primarily as a result of bond
swaps and the liquidation of equity securities held by Aflac
U.S. In 2005, we realized pretax gains of $262 million (after-
tax, $167 million, or $.33 per diluted share) primarily as a
result of bond swaps. We began our bond-swap program in
the second half of 2005 and concluded it in the first half of
2006. These bond swaps took advantage of tax loss
carryforwards and also resulted in an improvement in overall
portfolio credit quality and investment income.
During 2004, we received an issuer’s offer to redeem certain
available-for-sale yen-denominated debt securities held by the
Company. We accepted the issuer’s offer of $205 million and
recorded a pretax loss of $23 million. This investment loss and
other investment gains and losses in the normal course of
business decreased pretax earnings by $12 million (after-tax $5
million, or $.01 per diluted share).
Fair values of debt securities and privately issued equity
securities were determined using quotations provided by
outside securities pricing sources and/or compiled using data
provided by external debt and equity market sources. The data
used in estimating fair value include credit spreads of
comparably credit-rated securities and market quotations of
securities with similar maturity and call structure
characteristics. Fair values are then computed using standard