ADT 2012 Annual Report Download - page 73
Download and view the complete annual report
Please find page 73 of the 2012 ADT annual report below. You can navigate through the pages in the report by either clicking on the pages listed below, or by using the keyword search tool below to find specific information within the annual report.-
 1
1 -
2
-
3
-
4
-
5
-
6
-
7
-
8
-
9
-
10
-
11
-
12
-
13
-
14
-
15
-
16
-
17
-
18
-
19
-
20
-
21
-
22
-
23
-
24
-
25
-
26
-
27
-
28
-
29
-
30
-
31
-
32
-
33
-
34
-
35
-
36
-
37
-
38
-
39
-
40
-
41
-
42
-
43
-
44
-
45
-
46
-
47
-
48
-
49
-
50
-
51
-
52
-
53
-
54
-
55
-
56
-
57
-
58
-
59
-
60
-
61
-
62
-
 63
63 -
 64
64 -
 65
65 -
 66
66 -
 67
67 -
 68
68 -
 69
69 -
 70
70 -
 71
71 -
 72
72 -
 73
73 -
 74
74 -
 75
75 -
 76
76 -
 77
77 -
 78
78 -
 79
79 -
 80
80 -
 81
81 -
 82
82 -
 83
83 -
84
-
85
-
86
-
87
-
88
-
89
-
90
-
91
-
92
-
93
-
94
-
95
-
96
-
97
-
98
-
99
-
100
-
101
-
102
-
103
-
104
-
105
-
106
-
107
-
108
-
109
-
110
-
111
-
112
-
113
-
114
-
115
-
116
-
117
-
118
-
119
-
120
-
121
-
122
-
123
-
124
-
125
-
126
-
127
-
128
-
129
-
130
-
131
-
132
-
133
-
134
-
135
-
136
-
137
-
138
-
139
-
140
-
141
-
142
-
143
-
144
-
145
-
146
-
147
-
148
-
149
-
150
-
151
-
152
-
153
-
154
-
155
-
156
-
157
-
158
-
159
-
160
-
161
-
162
-
163
-
164
-
165
-
166
-
167
-
168
-
169
-
170
-
171
-
172
-
173
-
174
-
175
-
176
-
177
-
178
-
179
-
180
-
181
-
182
-
183
-
184
-
185
-
186
-
187
-
188
-
189
-
190
-
191
-
192
-
193
-
194
 |
 |

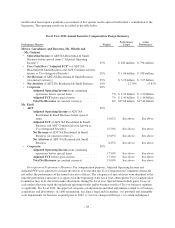
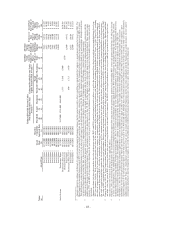
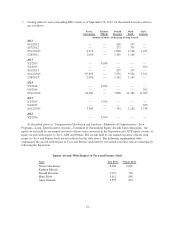
Grants of Plan-Based Awards Table
The following table summarizes cash-based and equity-based awards for each of the Company’s named executive officers that were granted during
fiscal year 2012 under the 2004 Tyco Stock and Incentive Plan.
Estimated Possible Payouts Under
Non-Equity Incentive Plan
Awards (1)
Estimated Possible Payouts Under
Equity Incentive Plan Awards (2)
All Other
Stock
Awards:
Number of
Shares
of Stock or
Units
(#)
(j)
All Other
Option
Awards:
Number of
Securities
Underlying
Options
(#)
(k)
Exercise or
Base
Price of
Option
Awards
($/Sh)
(l)
Grant Date
Fair Value of
Stock and
Option
Awards
($) (3)
(m)
Name
(a) Award Type
Grant
Date
(b)
Board or
Committee
Approval Date
(c)
Threshold
($)
(d)
Target
($)
(e)
Maximum
($)
(f)
Threshold
(#)
(g)
Target
(Mid-Point)
(#)
(h)
Maximum
(#)
(i)
Naren Gursahaney Performance Bonus 12/7/2011 12/7/2011 $305,000 $610,000 $1,220,000
Performance Share Unit 10/12/2011 10/12/2011 8,100 18,000 36,000 $889,502
Restricted Stock Unit 10/12/2011 10/12/2011 9,000 $398,880
Stock Option 10/12/2011 10/12/2011 66,800 $44.32 $877,612
Restricted Stock Unit (4) 12/8/2011 12/8/2011 2,649 $122,013
Performance Share Unit (5) 10/1/2009 8/2/2012 10,640 26,600 53,200 $149,167
Performance Share Unit (5) 10/12/2010 8/2/2012 4,280 10,700 21,400 $169,101
Performance Share Unit (5) 10/12/2011 8/2/2012 3,600 9,000 18,000 $ 18,353
Stock Option (6) 3/10/2005 10/12/2011 31,473 $56.87 $ 20,945
Stock Option (6) 11/22/2005 10/12/2011 25,178 $46.07 $ 25,960
Stock Option (6) 1/12/2006 10/12/2011 9,442 $48.67 $ 8,937
Stock Option (6) 11/21/2006 10/12/2011 88,125 $48.14 $ 88,620
Stock Option (6) 7/2/2007 10/12/2011 71,000 $53.36 $ 60,518
Stock Option (6) 8/18/2008 10/12/2011 35,000 $44.49 $ 39,731
Stock Option (6) 10/7/2008 10/12/2011 129,300 $29.00 $212,818
Stock Option (6) 10/1/2009 10/12/2011 95,200 $33.75 $148,003
Stock Option (6) 10/12/2010 10/12/2011 79,400 $37.29 $120,408
Stock Option (6) 10/12/2011 10/12/2011 66,800 $44.32 $ 94,993
Kathryn Mikells Performance Bonus 4/30/2012 4/30/2012 $244,800 $489,600 $ 979,200
Restricted Stock Unit 5/2/2012 5/2/2012 11,220 $624,954
Stock Option 5/2/2012 5/2/2012 41,550 $55.70 $685,899
Stock Option (6) 5/2/2012 5/2/2012 41,550 $55.70 $ 47,940
Donald Boerema Performance Bonus 12/7/2011 12/7/2011 $ 80,089 $160,178 $ 320,356
Performance Share Unit 10/12/2011 10/12/2011 860 1,910 3,820 $ 94,386
Restricted Stock Unit 10/12/2011 10/12/2011 1,860 $ 82,435
Stock Option 10/12/2011 10/12/2011 6,890 $44.32 $ 84,120
Restricted Stock Unit (4) 12/8/2011 12/8/2011 1,392 $ 64,116
Performance Share Unit (5) 10/1/2009 8/2/2012 1,244 3,110 6,220 $ 17,440
Performance Share Unit (5) 10/12/2010 8/2/2012 428 1,070 2,140 $ 16,910
Performance Share Unit (5) 10/12/2011 8/2/2012 382 955 1,910 $ 1,947
Stock Option (6) 11/19/2007 10/12/2011 9,820 $39.75 $ 12,662
Stock Option (6) 10/7/2008 10/12/2011 7,230 $29.00 $ 11,900
Stock Option (6) 10/1/2009 10/12/2011 5,550 $33.75 $ 8,627
Stock Option (6) 10/12/2010 10/12/2011 7,700 $37.29 $ 11,665
Stock Option (6) 10/12/2011 10/12/2011 6,890 $44.32 $ 9,796
Mark Edoff Performance Bonus 12/7/2011 12/7/2011 $102,000 $204,000 $ 408,000
Performance Share Unit 10/12/2011 10/12/2011 1,377 3,060 6,120 $151,216
Restricted Stock Unit 10/12/2011 10/12/2011 2,970 $131,630
Stock Option 10/12/2011 10/12/2011 11,030 $44.32 $134,665
Restricted Stock Unit (4) 12/8/2011 12/8/2011 1,477 $ 68,031
Performance Share Unit (5) 10/1/2009 8/2/2012 1,184 2,960 5,920 $ 16,599
Performance Share Unit (5) 10/12/2010 8/2/2012 546 1,365 2,730 $ 21,572
Performance Share Unit (5) 10/12/2011 8/2/2012 612 1,530 3,060 $ 3,120
-47-