ADT 2012 Annual Report Download - page 132
Download and view the complete annual report
Please find page 132 of the 2012 ADT annual report below. You can navigate through the pages in the report by either clicking on the pages listed below, or by using the keyword search tool below to find specific information within the annual report.-
 1
1 -
2
-
3
-
4
-
5
-
6
-
7
-
8
-
9
-
10
-
11
-
12
-
13
-
14
-
15
-
16
-
17
-
18
-
19
-
20
-
21
-
22
-
23
-
24
-
25
-
26
-
27
-
28
-
29
-
30
-
31
-
32
-
33
-
34
-
35
-
36
-
37
-
38
-
39
-
40
-
41
-
42
-
43
-
44
-
45
-
46
-
47
-
48
-
49
-
50
-
51
-
52
-
53
-
54
-
55
-
56
-
57
-
58
-
59
-
60
-
61
-
62
-
63
-
64
-
65
-
66
-
67
-
68
-
69
-
70
-
71
-
72
-
73
-
74
-
75
-
76
-
77
-
78
-
79
-
80
-
81
-
82
-
83
-
84
-
85
-
86
-
87
-
88
-
89
-
90
-
91
-
92
-
93
-
94
-
95
-
96
-
97
-
98
-
99
-
100
-
101
-
102
-
103
-
104
-
105
-
106
-
107
-
108
-
109
-
110
-
111
-
112
-
113
-
114
-
115
-
116
-
117
-
118
-
119
-
120
-
121
-
 122
122 -
 123
123 -
 124
124 -
 125
125 -
 126
126 -
 127
127 -
 128
128 -
 129
129 -
 130
130 -
 131
131 -
 132
132 -
 133
133 -
 134
134 -
 135
135 -
 136
136 -
 137
137 -
 138
138 -
 139
139 -
 140
140 -
 141
141 -
 142
142 -
143
-
144
-
145
-
146
-
147
-
148
-
149
-
150
-
151
-
152
-
153
-
154
-
155
-
156
-
157
-
158
-
159
-
160
-
161
-
162
-
163
-
164
-
165
-
166
-
167
-
168
-
169
-
170
-
171
-
172
-
173
-
174
-
175
-
176
-
177
-
178
-
179
-
180
-
181
-
182
-
183
-
184
-
185
-
186
-
187
-
188
-
189
-
190
-
191
-
192
-
193
-
194
 |
 |

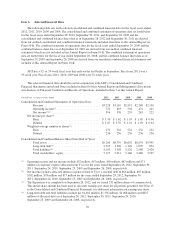
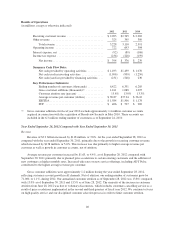
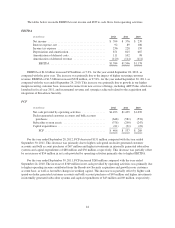
Results of Operations
(in millions, except as otherwise indicated)
2012 2011 2010
Recurring customer revenue ......................... $2,903 $2,765 $ 2,282
Other revenue .................................... 325 345 309
Total revenue ................................. 3,228 3,110 2,591
Operating income ................................. 722 693 504
Interest expense, net ............................... (92) (89) (106)
Income tax expense ................................ (236) (228) (159)
Net income ................................... $ 394 $ 376 $ 239
Summary Cash Flow Data:
Net cash provided by operating activities ........... $1,493 $1,439 $ 1,070
Net cash used in investing activities ............... (1,096) (909) (1,250)
Net cash (used in) provided by financing activities . . . (231) (548) 230
Key Performance Indicators:
Ending number of customers (thousands) ........... 6,422 6,351 6,285
Gross customer additions (thousands)(1) ............ 1,161 1,088 1,025
Customer attrition rate (percent) .................. 13.8% 13.0% 13.3%
Average revenue per customer (dollars) ............ $38.87 $37.24 $ 36.10
EBITDA ..................................... $1,584 $1,506 $ 1,178
FCF ........................................ $ 406 $ 537 $ 269
(1) Gross customer additions for fiscal year 2010 exclude approximately 1.4 million customer accounts
acquired in connection with the acquisition of Broadview Security in May 2010. These accounts are
included in the 6.3 million ending number of customers as of September 24, 2010.
Year Ended September 28, 2012 Compared with Year Ended September 30, 2011
Revenue
Revenue of $3.2 billion increased by $118 million, or 3.8%, for the year ended September 28, 2012 as
compared with the year ended September 30, 2011, primarily due to the growth in recurring customer revenue,
which increased by $138 million, or 5.0%. This increase was due primarily to higher average revenue per
customer as well as growth in customer accounts, net of attrition.
Average revenue per customer increased by $1.63, or 4.4%, as of September 28, 2012 compared with
September 30, 2011 primarily due to planned price escalations to certain existing customers and the addition of
new customers at higher monthly rates. Increased take rates on new service offerings, including ADT Pulse,
contributed to the higher average revenue per customer.
Gross customer additions were approximately 1.2 million during the year ended September 28, 2012,
reflecting customer account growth in all channels. Net of attrition, our ending number of customers grew by
71,000, or 1.1%, during 2012. Our annualized customer attrition as of September 28, 2012 was 13.8% compared
with 13.0% as of September 30, 2011 and 13.5% as of June 28, 2012. The majority of the increase in customer
attrition from June 28, 2012 was due to voluntary disconnects, which includes customers cancelling service as a
result of price escalations implemented in the second and third quarters of fiscal year 2012. We continue to focus
on high quality service and our disciplined customer selection process in order to limit customer attrition.
40