ADT 2012 Annual Report Download - page 135
Download and view the complete annual report
Please find page 135 of the 2012 ADT annual report below. You can navigate through the pages in the report by either clicking on the pages listed below, or by using the keyword search tool below to find specific information within the annual report.-
 1
1 -
2
-
3
-
4
-
5
-
6
-
7
-
8
-
9
-
10
-
11
-
12
-
13
-
14
-
15
-
16
-
17
-
18
-
19
-
20
-
21
-
22
-
23
-
24
-
25
-
26
-
27
-
28
-
29
-
30
-
31
-
32
-
33
-
34
-
35
-
36
-
37
-
38
-
39
-
40
-
41
-
42
-
43
-
44
-
45
-
46
-
47
-
48
-
49
-
50
-
51
-
52
-
53
-
54
-
55
-
56
-
57
-
58
-
59
-
60
-
61
-
62
-
63
-
64
-
65
-
66
-
67
-
68
-
69
-
70
-
71
-
72
-
73
-
74
-
75
-
76
-
77
-
78
-
79
-
80
-
81
-
82
-
83
-
84
-
85
-
86
-
87
-
88
-
89
-
90
-
91
-
92
-
93
-
94
-
95
-
96
-
97
-
98
-
99
-
100
-
101
-
102
-
103
-
104
-
105
-
106
-
107
-
108
-
109
-
110
-
111
-
112
-
113
-
114
-
115
-
116
-
117
-
118
-
119
-
120
-
121
-
122
-
123
-
124
-
 125
125 -
 126
126 -
 127
127 -
 128
128 -
 129
129 -
 130
130 -
 131
131 -
 132
132 -
 133
133 -
 134
134 -
 135
135 -
 136
136 -
 137
137 -
 138
138 -
 139
139 -
 140
140 -
 141
141 -
 142
142 -
 143
143 -
 144
144 -
 145
145 -
146
-
147
-
148
-
149
-
150
-
151
-
152
-
153
-
154
-
155
-
156
-
157
-
158
-
159
-
160
-
161
-
162
-
163
-
164
-
165
-
166
-
167
-
168
-
169
-
170
-
171
-
172
-
173
-
174
-
175
-
176
-
177
-
178
-
179
-
180
-
181
-
182
-
183
-
184
-
185
-
186
-
187
-
188
-
189
-
190
-
191
-
192
-
193
-
194
 |
 |
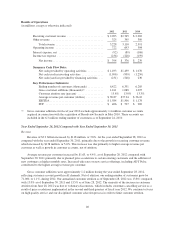
Income Tax Expense
Income tax expense of $228 million increased $69 million for the year ended September 30, 2011 as
compared with the year ended September 24, 2010, while the effective tax rate decreased to 37.7% from 39.9%.
The increase in the tax expense is primarily related to an increase in pre-tax income of $206 million, while the
decrease in the effective tax rate for the year ended September 30, 2011 was primarily the result of a decrease in
the overall effective state income tax rate. The effective tax rate can vary from year to year due to permanent tax
adjustments, discrete items such as the settlement of income tax audits and changes in tax laws, as well as
recurring factors such as changes in the overall effective state tax rate.
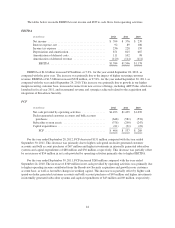
Non-GAAP Measures
In an effort to provide investors with additional information regarding our results as determined by GAAP,
we also disclose non-GAAP measures which management believes provide useful information to investors.
These measures consist of EBITDA and FCF. These measures are not financial measures under GAAP and
should not be considered as substitutes for net income, operating profit, cash from operating activities or any
other operating performance measure calculated in accordance with GAAP, and they may not be comparable to
similarly titled measures reported by other companies. We use EBITDA to measure the operational strength and
performance of our business. We use FCF as an additional performance measure of our ability to service debt and
make investments. These measures, or measures that are based on them, may be used as components in our
incentive compensation plans.
We believe EBITDA is useful because it measures our success in acquiring, retaining and servicing our
customer base and our ability to generate and grow our recurring revenue while providing a high level of
customer service in a cost-effective manner. EBITDA excludes interest expense and the provision for income
taxes. Excluding these items eliminates the expenses associated with our capitalization and tax structure. Because
EBITDA excludes interest expense, it does not give effect to cash used for debt service requirements and thus
does not reflect available funds for distributions, reinvestment or other discretionary uses. EBITDA also excludes
depreciation and amortization, which eliminates the impact of non-cash charges related to capital investments.
Depreciation and amortization includes depreciation of subscriber system assets and other fixed assets,
amortization of deferred costs and deferred revenue associated with subscriber acquisitions and amortization of
dealer and other intangible assets.
There are material limitations to using EBITDA. EBITDA may not be comparable to similarly titled
measures reported by other companies. Furthermore, EBITDA does not take into account certain significant
items, including depreciation and amortization, interest expense and tax expense, which directly affect our net
income. These limitations are best addressed by considering the economic effects of the excluded items
independently, and by considering EBITDA in conjunction with net income as calculated in accordance with
GAAP.
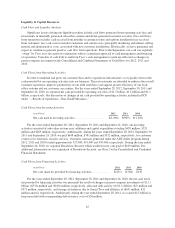
FCF is defined as cash from operations less cash outlays related to capital expenditures, subscriber system
assets, dealer generated customer accounts and bulk account purchases. Dealer generated accounts are accounts
that are generated through our network of authorized dealers. Bulk account purchases represent accounts that we
acquire from third parties outside of our authorized dealer network, such as other security service providers, on a
selective basis. These items are subtracted from cash from operating activities because they represent long-term
investments that are required for normal business activities. As a result, FCF is a useful measure of our cash that
is free from significant existing obligations and available for other uses.
Furthermore, FCF adjusts for cash items that are ultimately within management’s and the board of directors’
discretion to direct and therefore may imply that there is less or more cash that is available for our programs than
the most comparable GAAP measure. This limitation is best addressed by using FCF in combination with the
GAAP cash flow numbers.
43