ADT 2012 Annual Report Download - page 137
Download and view the complete annual report
Please find page 137 of the 2012 ADT annual report below. You can navigate through the pages in the report by either clicking on the pages listed below, or by using the keyword search tool below to find specific information within the annual report.-
 1
1 -
2
-
3
-
4
-
5
-
6
-
7
-
8
-
9
-
10
-
11
-
12
-
13
-
14
-
15
-
16
-
17
-
18
-
19
-
20
-
21
-
22
-
23
-
24
-
25
-
26
-
27
-
28
-
29
-
30
-
31
-
32
-
33
-
34
-
35
-
36
-
37
-
38
-
39
-
40
-
41
-
42
-
43
-
44
-
45
-
46
-
47
-
48
-
49
-
50
-
51
-
52
-
53
-
54
-
55
-
56
-
57
-
58
-
59
-
60
-
61
-
62
-
63
-
64
-
65
-
66
-
67
-
68
-
69
-
70
-
71
-
72
-
73
-
74
-
75
-
76
-
77
-
78
-
79
-
80
-
81
-
82
-
83
-
84
-
85
-
86
-
87
-
88
-
89
-
90
-
91
-
92
-
93
-
94
-
95
-
96
-
97
-
98
-
99
-
100
-
101
-
102
-
103
-
104
-
105
-
106
-
107
-
108
-
109
-
110
-
111
-
112
-
113
-
114
-
115
-
116
-
117
-
118
-
119
-
120
-
121
-
122
-
123
-
124
-
125
-
126
-
 127
127 -
 128
128 -
 129
129 -
 130
130 -
 131
131 -
 132
132 -
 133
133 -
 134
134 -
 135
135 -
 136
136 -
 137
137 -
 138
138 -
 139
139 -
 140
140 -
 141
141 -
 142
142 -
 143
143 -
 144
144 -
 145
145 -
 146
146 -
 147
147 -
148
-
149
-
150
-
151
-
152
-
153
-
154
-
155
-
156
-
157
-
158
-
159
-
160
-
161
-
162
-
163
-
164
-
165
-
166
-
167
-
168
-
169
-
170
-
171
-
172
-
173
-
174
-
175
-
176
-
177
-
178
-
179
-
180
-
181
-
182
-
183
-
184
-
185
-
186
-
187
-
188
-
189
-
190
-
191
-
192
-
193
-
194
 |
 |

Liquidity & Capital Resources
Cash Flow and Liquidity Analysis
Significant factors driving our liquidity position include cash flows generated from operating activities and
investments in internally generated subscriber systems and dealer generated customer accounts. Our cash flows
from operations includes cash received from monthly recurring revenue and upfront installation fees received
from customers, less cash costs to monitor customers and certain costs, principally marketing and indirect selling,
general and administrative costs, associated with new customer installations. Historically, we have generated and
expect to continue to generate positive cash flow from operations. Prior to the Separation, our cash was regularly
“swept” by Tyco at its discretion in conjunction with its centralized approach to cash management and financing
of operations. Transfers of cash both to and from Tyco’s cash management system are reflected as changes in
parent company investment in the Consolidated and Combined Statements of Cash Flows for 2012, 2011 and
2010.
Cash Flows from Operating Activities
In order to maintain and grow our customer base and to expand our infrastructure, we typically reinvest the
cash provided by our operating activities into our business. These investments are intended to enhance the overall
customer experience, improve productivity of our field workforce and support greater efficiency of our back
office systems and our customer care centers. For the years ended September 28, 2012, September 30, 2011 and
September 24, 2010, we reported net cash provided by operating activities of $1.5 billion, $1.4 billion and $1.1
billion, respectively. See discussion of changes in net cash provided by operating activities included in FCF
under “—Results of Operations—Non-GAAP Measures.”
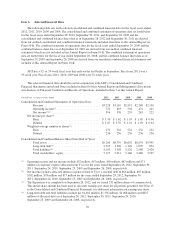
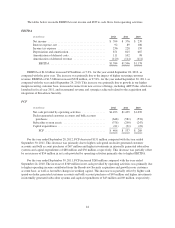
Cash Flows from Investing Activities
(in millions) 2012 2011 2010
Net cash used in investing activities .................... $(1,096) $(909) $(1,250)
For the years ended September 28, 2012, September 30, 2011 and September 24, 2010, our investing
activities consisted of subscriber system asset additions and capital expenditures totaling $439 million, $321
million and $269 million, respectively. Additionally, during the years ended September 28, 2012, September 30,
2011 and September 24, 2010, we paid $648 million, $581 million and $532 million, respectively, for customer
contracts for electronic security services. Customer contracts generated under the ADT dealer program during
2012, 2011 and 2010 totaled approximately 527,000, 491,000 and 459,000, respectively. During the year ended
September 24, 2010, we acquired Broadview Security which resulted in net cash paid of $449 million. For
additional information on our acquisition of Broadview Security, see Note 2 to the Consolidated and Combined
Financial Statements.
Cash Flows from Financing Activities
(in millions) 2012 2011 2010
Net cash (used in) provided by financing activities ............ $(231) $(548) $230
For the years ended September 28, 2012, September 30, 2011 and September 24, 2010, the net cash (used
in) provided by financing activities was primarily the result of changes in parent company investment of ($1.1)
billion, ($574) million and ($140) million, respectively, allocated debt activity of ($1.5) billion, ($5) million and
$371 million, respectively, and changes in balances due to (from) Tyco and affiliates of ($63) million, $32
million and nil, respectively. Additionally, during the year ended September 28, 2012, we issued $2.5 billion in
long-term debt with corresponding debt issuance costs of $26 million.
45