ADT 2012 Annual Report Download - page 134
Download and view the complete annual report
Please find page 134 of the 2012 ADT annual report below. You can navigate through the pages in the report by either clicking on the pages listed below, or by using the keyword search tool below to find specific information within the annual report.-
 1
1 -
2
-
3
-
4
-
5
-
6
-
7
-
8
-
9
-
10
-
11
-
12
-
13
-
14
-
15
-
16
-
17
-
18
-
19
-
20
-
21
-
22
-
23
-
24
-
25
-
26
-
27
-
28
-
29
-
30
-
31
-
32
-
33
-
34
-
35
-
36
-
37
-
38
-
39
-
40
-
41
-
42
-
43
-
44
-
45
-
46
-
47
-
48
-
49
-
50
-
51
-
52
-
53
-
54
-
55
-
56
-
57
-
58
-
59
-
60
-
61
-
62
-
63
-
64
-
65
-
66
-
67
-
68
-
69
-
70
-
71
-
72
-
73
-
74
-
75
-
76
-
77
-
78
-
79
-
80
-
81
-
82
-
83
-
84
-
85
-
86
-
87
-
88
-
89
-
90
-
91
-
92
-
93
-
94
-
95
-
96
-
97
-
98
-
99
-
100
-
101
-
102
-
103
-
104
-
105
-
106
-
107
-
108
-
109
-
110
-
111
-
112
-
113
-
114
-
115
-
116
-
117
-
118
-
119
-
120
-
121
-
122
-
123
-
 124
124 -
 125
125 -
 126
126 -
 127
127 -
 128
128 -
 129
129 -
 130
130 -
 131
131 -
 132
132 -
 133
133 -
 134
134 -
 135
135 -
 136
136 -
 137
137 -
 138
138 -
 139
139 -
 140
140 -
 141
141 -
 142
142 -
 143
143 -
 144
144 -
145
-
146
-
147
-
148
-
149
-
150
-
151
-
152
-
153
-
154
-
155
-
156
-
157
-
158
-
159
-
160
-
161
-
162
-
163
-
164
-
165
-
166
-
167
-
168
-
169
-
170
-
171
-
172
-
173
-
174
-
175
-
176
-
177
-
178
-
179
-
180
-
181
-
182
-
183
-
184
-
185
-
186
-
187
-
188
-
189
-
190
-
191
-
192
-
193
-
194
 |
 |
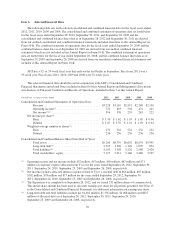
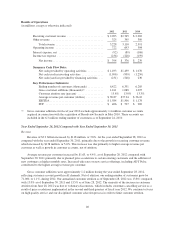
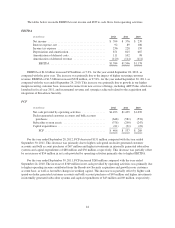
Year Ended September 30, 2011 Compared with Year Ended September 24, 2010
Revenue
Revenue of $3.1 billion increased by $519 million, or 20.0%, for the year ended September 30, 2011 as
compared with the year ended September 24, 2010, primarily due to the growth in recurring customer revenue,
which increased by $483 million, or 21.2%. The increase in recurring revenue includes approximately $339
million due to the acquisition of Broadview Security in May 2010. In addition, an estimated $4 million of
revenue is attributable to the additional week in fiscal year 2011. The remaining increase was primarily due to
higher average revenue per customer as well as growth in customer accounts, net of attrition.
Average revenue per customer increased by $1.14, or 3.2%, as of September 30, 2011 compared with
September 24, 2010 primarily due to planned price escalations to certain existing customers. The increase in
average revenue per customer was also driven by the addition of new customers at higher monthly rates as well
as increased take rates on new service offerings. Such offerings included the launch of ADT Pulse, which
generates average revenue per customer that, on average, is approximately $10 higher than we generate on our
standard services.
Gross customer additions were approximately 1.1 million during the year ended September 30, 2011,
reflecting customer account growth from all channels. Net of attrition, our ending number of customers grew by
66,000, or 1.1%, during 2011. Our annualized customer attrition as of September 30, 2011 was 13.0% compared
with 13.3% as of September 24, 2010. We attribute the reduction in customer attrition to our disciplined
customer selection process and our continued focus on high quality service.
Operating Income
Operating income of $693 million increased by $189 million, or 37.5%, for the year ended September 30,
2011 as compared with the year ended September 24, 2010. Operating margin was 22.3% for the year ended
September 30, 2011 compared with 19.5% for the year ended September 24, 2010. Operating income and
operating margin for the year ended September 30, 2011 were favorably impacted by the increase in recurring
customer revenue at a higher average revenue per customer and synergies achieved from the integration of
Broadview Security.
During fiscal year 2011, we continued to integrate Broadview Security, which resulted in synergies related
to the elimination of redundant facilities, headcount and marketing costs. We estimate these synergies
contributed approximately $102 million of operating income benefit for the year ended September 30, 2011,
compared with $30 million for the prior year. To achieve these synergies, we incurred $28 million of integration
costs for the year ended September 30, 2011, compared with $18 million of integration costs and $17 million of
acquisition costs for the prior year.
In addition, for the year ended September 24, 2010, we recorded restructuring expenses of $18 million, of
which we incurred $14 million in conjunction with the Broadview Security acquisition, as compared with nil in
the year ended September 30, 2011. Lastly, operating income was unfavorably impacted by approximately $5
million due to the 53rd week in fiscal year 2011.
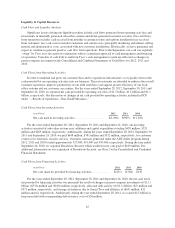
Interest Expense, net
Net interest expense was $89 million for the year ended September 30, 2011 as compared with $106 million
for the year ended September 24, 2010. Included in the year ended September 30, 2011 was $87 million of
allocated interest expense related to Tyco’s external debt compared with $102 million for the year ended
September 24, 2010.
42