ADT 2012 Annual Report Download - page 4
Download and view the complete annual report
Please find page 4 of the 2012 ADT annual report below. You can navigate through the pages in the report by either clicking on the pages listed below, or by using the keyword search tool below to find specific information within the annual report.-
 1
1 -
 2
2 -
 3
3 -
 4
4 -
 5
5 -
 6
6 -
 7
7 -
 8
8 -
 9
9 -
 10
10 -
 11
11 -
 12
12 -
 13
13 -
 14
14 -
 15
15 -
16
-
17
-
18
-
19
-
20
-
21
-
22
-
23
-
24
-
25
-
26
-
27
-
28
-
29
-
30
-
31
-
32
-
33
-
34
-
35
-
36
-
37
-
38
-
39
-
40
-
41
-
42
-
43
-
44
-
45
-
46
-
47
-
48
-
49
-
50
-
51
-
52
-
53
-
54
-
55
-
56
-
57
-
58
-
59
-
60
-
61
-
62
-
63
-
64
-
65
-
66
-
67
-
68
-
69
-
70
-
71
-
72
-
73
-
74
-
75
-
76
-
77
-
78
-
79
-
80
-
81
-
82
-
83
-
84
-
85
-
86
-
87
-
88
-
89
-
90
-
91
-
92
-
93
-
94
-
95
-
96
-
97
-
98
-
99
-
100
-
101
-
102
-
103
-
104
-
105
-
106
-
107
-
108
-
109
-
110
-
111
-
112
-
113
-
114
-
115
-
116
-
117
-
118
-
119
-
120
-
121
-
122
-
123
-
124
-
125
-
126
-
127
-
128
-
129
-
130
-
131
-
132
-
133
-
134
-
135
-
136
-
137
-
138
-
139
-
140
-
141
-
142
-
143
-
144
-
145
-
146
-
147
-
148
-
149
-
150
-
151
-
152
-
153
-
154
-
155
-
156
-
157
-
158
-
159
-
160
-
161
-
162
-
163
-
164
-
165
-
166
-
167
-
168
-
169
-
170
-
171
-
172
-
173
-
174
-
175
-
176
-
177
-
178
-
179
-
180
-
181
-
182
-
183
-
184
-
185
-
186
-
187
-
188
-
189
-
190
-
191
-
192
-
193
-
194
 |
 |

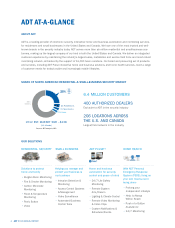
• Growourcustomerbase. In 2012, we continued
to recruit new customers, posting an increase
of about 7 percent over last year. Sparking this
growth are our 4,500 eld-based and phone sales
representatives, our network of 400 ADT Authorized
Dealers, and a diverse roster of lead-generation
partners that include USAA, AARP, homebuilders
and utility companies.
• Optimizethecostofmarketing,sellingandinstalling
newcustomeraccounts. We strive to reduce costs
across each step of the new customer enrollment
process. At the time of sale, ADT makes an invest-
ment we recoup over time through the monthly
charge plus an upfront installation charge. With ADT
PulseTM, our highly successful home and small-busi-
ness automation offering, we’re incurring a modest
increase in our upfront investment, reecting more
expensive equipment and longer installation time.
We’re nding new ways to lower these costs through
productivity programs, including automating our pro-
visioning process to minimize the number of people
beyond the technician involved in the installation.
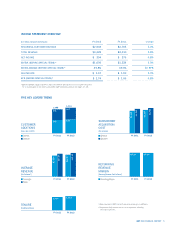
• Increasethemonthlyrevenuefromcustomers.
ADT Pulse has driven a substantial increase in new
residential revenue per customer from about $38 in
2009 before we launched ADT Pulse, to about $42 per
month in 2012. We expect this trend to continue as we
add new features and capabilities, expand Pulse’s avail-
ability in our authorized dealer program and increase
our share of the small-business security market.
• Lowerthecostofservicedelivery. Cost to Serve
encompasses ongoing expenses including customer
service, maintenance and general and administra-
tive costs related to providing monitoring and other
services to each customer. As part of our long-term
growth strategy, we are committed to giving customers
new offerings, such as MyADT.com, a digital resource
that lets customers manage their security system
online, download equipment manuals or videos, order
new yard signs and print burglar and re alarm certi-
cates for their insurers. We are also investing in more
remote monitoring and repair capabilities to reduce
on-site service calls wherever possible.
• Lengthenthetimeweretainourcustomers. This is a
critical area of focus. We are assessing the entire acqui-
sition-and-service chain to gauge how we can serve our
customers better and retain them longer. This involves
pursuing the right customers with the right character-
istics, ensuring they engage with and value their ADT
systems, and consistently delivering excellent service.
While all of these value drivers are important, each has
a slightly different impact on our nancial performance.
We may pursue initiatives that improve one of these
drivers while adversely impacting another, but we model
our initiatives and implement them to maximize the
creation of value overall.
ADT’s nancial performance in scal 2012 demonstrated
our ability to optimize our value drivers to create share-
holder value. Revenues rose 3.8 percent to $3.2 billion
and recurring revenues increased 5 percent to $2.9
billion. Net income climbed 5 percent to $394 million.
Steady-state free cash ow, an important indicator of
the cash ow generation capability of our base busi-
ness, was $952 million for the year. Earnings before
interest, taxes, depreciation and amortization (EBITDA)
before special items grew 5 percent to $1.6 billion, and
our EBITDA margin before special items improved 50
basis points to 49.8 percent. Diluted earnings per share
totaled $1.67, or $1.74 before special items.
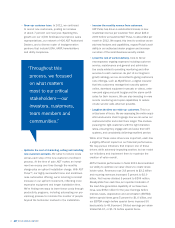
“ Throughout this
process, we focused
on what matters
most to our critical
stakeholders—our
investors, customers,
team members and
communities.”
2 ADT 2012 ANNUAL REPORT