ADT 2012 Annual Report Download - page 7
Download and view the complete annual report
Please find page 7 of the 2012 ADT annual report below. You can navigate through the pages in the report by either clicking on the pages listed below, or by using the keyword search tool below to find specific information within the annual report.-
 1
1 -
 2
2 -
 3
3 -
 4
4 -
 5
5 -
 6
6 -
 7
7 -
 8
8 -
 9
9 -
 10
10 -
 11
11 -
 12
12 -
 13
13 -
 14
14 -
 15
15 -
 16
16 -
 17
17 -
 18
18 -
19
-
20
-
21
-
22
-
23
-
24
-
25
-
26
-
27
-
28
-
29
-
30
-
31
-
32
-
33
-
34
-
35
-
36
-
37
-
38
-
39
-
40
-
41
-
42
-
43
-
44
-
45
-
46
-
47
-
48
-
49
-
50
-
51
-
52
-
53
-
54
-
55
-
56
-
57
-
58
-
59
-
60
-
61
-
62
-
63
-
64
-
65
-
66
-
67
-
68
-
69
-
70
-
71
-
72
-
73
-
74
-
75
-
76
-
77
-
78
-
79
-
80
-
81
-
82
-
83
-
84
-
85
-
86
-
87
-
88
-
89
-
90
-
91
-
92
-
93
-
94
-
95
-
96
-
97
-
98
-
99
-
100
-
101
-
102
-
103
-
104
-
105
-
106
-
107
-
108
-
109
-
110
-
111
-
112
-
113
-
114
-
115
-
116
-
117
-
118
-
119
-
120
-
121
-
122
-
123
-
124
-
125
-
126
-
127
-
128
-
129
-
130
-
131
-
132
-
133
-
134
-
135
-
136
-
137
-
138
-
139
-
140
-
141
-
142
-
143
-
144
-
145
-
146
-
147
-
148
-
149
-
150
-
151
-
152
-
153
-
154
-
155
-
156
-
157
-
158
-
159
-
160
-
161
-
162
-
163
-
164
-
165
-
166
-
167
-
168
-
169
-
170
-
171
-
172
-
173
-
174
-
175
-
176
-
177
-
178
-
179
-
180
-
181
-
182
-
183
-
184
-
185
-
186
-
187
-
188
-
189
-
190
-
191
-
192
-
193
-
194
 |
 |

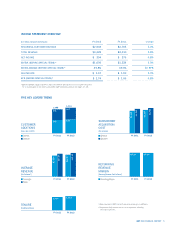
INCOMESTATEMENTOVERVIEW
($ in millions, except per-share amounts) FY 2012 FY 2011 Change
RECURRING CUSTOMER REVENUE $2,903 $2,765 5.0%
TOTAL REVENUE $3,228 $3,110 3.8%
NET INCOME $ 394 $ 376 4.8%
EBITDA (BEFORE SPECIAL ITEMS)* $1,609 $1,534 4.9%
EBITDA MARGIN (BEFORE SPECIAL ITEMS)* 49.8% 49.3% 50 BPS
DILUTED EPS $ 1.67 $ 1.59 5.0%
EPS (BEFORE SPECIAL ITEMS)* $ 1.74 $ 1.66 4.8%
* EBITDA, EBITDA margin and EPS in each case before special items are non-GAAP measures.
For a reconciliation to the most comparable GAAP measures, please see pages 17–18.
ADT 2012 ANNUAL REPORT 5
FIVEKEYLEVERSTREND
CUSTOMER
ADDITIONS
(Gross adds in 000’s)
597
491
FY2011
1,088
634
527
FY2012
1,161
FY2011 FY2012
Direct
Dealer
$1,157
$1,255
$1,115
$1,212
SUBSCRIBER
ACQUISITION
COST
(Per Customer)
Direct
Dealer
1 New represents ARPU for both new and resale gross additions.
2 Represents fully-loaded cost to serve expenses including
corporate expenses.
FY2011 FY2012
TENURE
(T12M Net Attrition)
13.0% 13.8%
FY2011 FY2012
Average
New
AVERAGE
REVENUE
(Per Customer)
FY2011 FY2012
Existing Base
RECURRING
REVENUE
MARGIN
(Recurring Revenue—Cost to Serve)
67.8% 67.5%
$37.24
$40.55
$42.02
$38.87