ADT 2012 Annual Report Download - page 181
Download and view the complete annual report
Please find page 181 of the 2012 ADT annual report below. You can navigate through the pages in the report by either clicking on the pages listed below, or by using the keyword search tool below to find specific information within the annual report.-
 1
1 -
2
-
3
-
4
-
5
-
6
-
7
-
8
-
9
-
10
-
11
-
12
-
13
-
14
-
15
-
16
-
17
-
18
-
19
-
20
-
21
-
22
-
23
-
24
-
25
-
26
-
27
-
28
-
29
-
30
-
31
-
32
-
33
-
34
-
35
-
36
-
37
-
38
-
39
-
40
-
41
-
42
-
43
-
44
-
45
-
46
-
47
-
48
-
49
-
50
-
51
-
52
-
53
-
54
-
55
-
56
-
57
-
58
-
59
-
60
-
61
-
62
-
63
-
64
-
65
-
66
-
67
-
68
-
69
-
70
-
71
-
72
-
73
-
74
-
75
-
76
-
77
-
78
-
79
-
80
-
81
-
82
-
83
-
84
-
85
-
86
-
87
-
88
-
89
-
90
-
91
-
92
-
93
-
94
-
95
-
96
-
97
-
98
-
99
-
100
-
101
-
102
-
103
-
104
-
105
-
106
-
107
-
108
-
109
-
110
-
111
-
112
-
113
-
114
-
115
-
116
-
117
-
118
-
119
-
120
-
121
-
122
-
123
-
124
-
125
-
126
-
127
-
128
-
129
-
130
-
131
-
132
-
133
-
134
-
135
-
136
-
137
-
138
-
139
-
140
-
141
-
142
-
143
-
144
-
145
-
146
-
147
-
148
-
149
-
150
-
151
-
152
-
153
-
154
-
155
-
156
-
157
-
158
-
159
-
160
-
161
-
162
-
163
-
164
-
165
-
166
-
167
-
168
-
169
-
170
-
 171
171 -
 172
172 -
 173
173 -
 174
174 -
 175
175 -
 176
176 -
 177
177 -
 178
178 -
 179
179 -
 180
180 -
 181
181 -
 182
182 -
 183
183 -
 184
184 -
 185
185 -
 186
186 -
 187
187 -
 188
188 -
 189
189 -
 190
190 -
 191
191 -
192
-
193
-
194
 |
 |

The Company’s plan assets are accounted for at fair value. Authoritative guidance for fair value
measurements establishes a three level hierarchy that ranks the quality and reliability of information used in
developing fair value estimates. The hierarchy gives the highest priority to quoted prices in active markets and
the lowest priority to unobservable data. In cases where two or more levels of inputs are used to determine fair
value, the level is determined based on the lowest level input that is considered significant to the fair value
measurement in its entirety. The three levels of the fair value hierarchy are summarized as follows:
• Level 1—inputs are based upon quoted prices (unadjusted) in active markets for identical assets or
liabilities which are accessible as of the measurement date.
• Level 2—inputs are based upon quoted prices for similar assets or liabilities in active markets, quoted
prices for identical or similar assets or liabilities in markets that are not active, and model derived
valuations for the asset or liability that are derived principally from or corroborated by market data for
which the primary inputs are observable, including forward interest rates, yield curves, credit risk and
exchange rates.
• Level 3—inputs for the valuations are unobservable and are based on management’s estimates of
assumptions that market participants would use in pricing the asset or liability. The fair values are
therefore determined using model based techniques such as option pricing models and discounted cash
flow models.
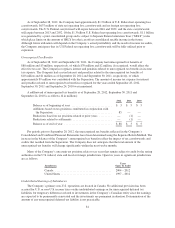
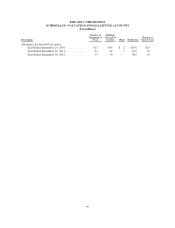
The Company’s asset allocations by level within the fair value hierarchy as of September 28, 2012 and
September 30, 2011 are presented in the table below for the Company’s defined benefit plan.
September 28, 2012
($ in millions) Level 1 Level 2 Total
Equity securities:
U.S. equity securities ............................... $— $21 $21
Non-U.S. equity securities ........................... — 10 10
Fixed income securities:
Government and government agency securities .......... — 10 10
Corporate debt securities ............................ — 10 10
Cash and cash equivalents ............................... — 1 1
Total ................................................ $— $52 $52
September 30, 2011
($ in millions) Level 1 Level 2 Total
Equity securities:
U.S. equity securities ............................... $ 4 $ 7 $11
Non-U.S. equity securities ........................... 3 10 13
Fixed income securities:
Government and government agency securities .......... 1 9 10
Corporate debt securities ............................ — 12 12
Mortgage and other asset-backed securities .............. — 1 1
Cash and cash equivalents ............................... 1 — 1
Total ................................................ $ 9 $ 39 $48
89