ADT 2012 Annual Report Download - page 131
Download and view the complete annual report
Please find page 131 of the 2012 ADT annual report below. You can navigate through the pages in the report by either clicking on the pages listed below, or by using the keyword search tool below to find specific information within the annual report.-
 1
1 -
2
-
3
-
4
-
5
-
6
-
7
-
8
-
9
-
10
-
11
-
12
-
13
-
14
-
15
-
16
-
17
-
18
-
19
-
20
-
21
-
22
-
23
-
24
-
25
-
26
-
27
-
28
-
29
-
30
-
31
-
32
-
33
-
34
-
35
-
36
-
37
-
38
-
39
-
40
-
41
-
42
-
43
-
44
-
45
-
46
-
47
-
48
-
49
-
50
-
51
-
52
-
53
-
54
-
55
-
56
-
57
-
58
-
59
-
60
-
61
-
62
-
63
-
64
-
65
-
66
-
67
-
68
-
69
-
70
-
71
-
72
-
73
-
74
-
75
-
76
-
77
-
78
-
79
-
80
-
81
-
82
-
83
-
84
-
85
-
86
-
87
-
88
-
89
-
90
-
91
-
92
-
93
-
94
-
95
-
96
-
97
-
98
-
99
-
100
-
101
-
102
-
103
-
104
-
105
-
106
-
107
-
108
-
109
-
110
-
111
-
112
-
113
-
114
-
115
-
116
-
117
-
118
-
119
-
120
-
 121
121 -
 122
122 -
 123
123 -
 124
124 -
 125
125 -
 126
126 -
 127
127 -
 128
128 -
 129
129 -
 130
130 -
 131
131 -
 132
132 -
 133
133 -
 134
134 -
 135
135 -
 136
136 -
 137
137 -
 138
138 -
 139
139 -
 140
140 -
 141
141 -
142
-
143
-
144
-
145
-
146
-
147
-
148
-
149
-
150
-
151
-
152
-
153
-
154
-
155
-
156
-
157
-
158
-
159
-
160
-
161
-
162
-
163
-
164
-
165
-
166
-
167
-
168
-
169
-
170
-
171
-
172
-
173
-
174
-
175
-
176
-
177
-
178
-
179
-
180
-
181
-
182
-
183
-
184
-
185
-
186
-
187
-
188
-
189
-
190
-
191
-
192
-
193
-
194
 |
 |
Customer Attrition Rate. Our economic model is highly dependent on customer retention. Success in retaining
customers is driven in part by our discipline in accepting new customers with favorable characteristics and by
providing high quality equipment, installation, monitoring and customer service. We evaluate our customer
retention based upon the recurring revenue lost resulting from customer attrition, net of dealer charge-backs and
re-sales. Dealer charge-backs represent customer cancellations charged back to the dealers because the customer
cancelled service during the initial period of the contract, generally 12 to 15 months. Re-sales are inactive
customer sites that are returned to active service during the period. The attrition rate is a 52 week trailing ratio,
the numerator of which is the annualized recurring revenue lost during the period due to attrition and the
denominator of which is total annualized recurring revenue based on an average of recurring revenue under
contract at the beginning of each month during the period.
Recurring Customer Revenue. Recurring customer revenue is generated by contractual monthly recurring fees for
monitoring and other recurring services provided to our customers. For fiscal year 2012, recurring customer
revenue represented approximately 90% of total revenue. Our other revenue, which represented the remaining
10% of total revenue in fiscal year 2012, consists of revenue associated with sale of equipment, deferred revenue
related to upfront installations fees, non-routine repair and maintenance services and customer termination
charges.
Average Revenue per Customer. Average revenue per customer measures the average amount of recurring
revenue per customer per month, and is calculated based on the recurring revenue under contract at the end of the
period, divided by the total number of customers under contract at the end of the period.
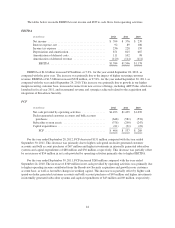
Earnings before interest, taxes, depreciation and amortization (“EBITDA”). EBITDA is a non-GAAP measure
reflecting net income adjusted for interest, taxes and certain non-cash items which include depreciation of
subscriber system assets and other fixed assets, amortization of deferred costs and deferred revenue associated
with customer acquisitions, and amortization of dealer and other intangible assets. We believe EBITDA is useful
to provide investors with information about operating profits, adjusted for significant non-cash items, generated
from the existing customer base. A reconciliation of EBITDA to net income (the most comparable GAAP
measure) is provided under “—Results of Operations—Non-GAAP Measures.”
Free Cash Flow (“FCF”). FCF is a non-GAAP measure that our management employs to measure cash that is
free from any significant existing obligation and is available to service debt and make investments. The
difference between net cash provided by operating activities (the most comparable GAAP measure) and FCF is
cash outlays for capital expenditures, subscriber system assets, dealer generated customer accounts and bulk
account purchases. A reconciliation of FCF to net cash provided by operating activities is provided under
“—Results of Operations—Non-GAAP Measures.”
39