ADT 2012 Annual Report Download - page 168
Download and view the complete annual report
Please find page 168 of the 2012 ADT annual report below. You can navigate through the pages in the report by either clicking on the pages listed below, or by using the keyword search tool below to find specific information within the annual report.-
 1
1 -
2
-
3
-
4
-
5
-
6
-
7
-
8
-
9
-
10
-
11
-
12
-
13
-
14
-
15
-
16
-
17
-
18
-
19
-
20
-
21
-
22
-
23
-
24
-
25
-
26
-
27
-
28
-
29
-
30
-
31
-
32
-
33
-
34
-
35
-
36
-
37
-
38
-
39
-
40
-
41
-
42
-
43
-
44
-
45
-
46
-
47
-
48
-
49
-
50
-
51
-
52
-
53
-
54
-
55
-
56
-
57
-
58
-
59
-
60
-
61
-
62
-
63
-
64
-
65
-
66
-
67
-
68
-
69
-
70
-
71
-
72
-
73
-
74
-
75
-
76
-
77
-
78
-
79
-
80
-
81
-
82
-
83
-
84
-
85
-
86
-
87
-
88
-
89
-
90
-
91
-
92
-
93
-
94
-
95
-
96
-
97
-
98
-
99
-
100
-
101
-
102
-
103
-
104
-
105
-
106
-
107
-
108
-
109
-
110
-
111
-
112
-
113
-
114
-
115
-
116
-
117
-
118
-
119
-
120
-
121
-
122
-
123
-
124
-
125
-
126
-
127
-
128
-
129
-
130
-
131
-
132
-
133
-
134
-
135
-
136
-
137
-
138
-
139
-
140
-
141
-
142
-
143
-
144
-
145
-
146
-
147
-
148
-
149
-
150
-
151
-
152
-
153
-
154
-
155
-
156
-
157
-
 158
158 -
 159
159 -
 160
160 -
 161
161 -
 162
162 -
 163
163 -
 164
164 -
 165
165 -
 166
166 -
 167
167 -
 168
168 -
 169
169 -
 170
170 -
 171
171 -
 172
172 -
 173
173 -
 174
174 -
 175
175 -
 176
176 -
 177
177 -
 178
178 -
179
-
180
-
181
-
182
-
183
-
184
-
185
-
186
-
187
-
188
-
189
-
190
-
191
-
192
-
193
-
194
 |
 |

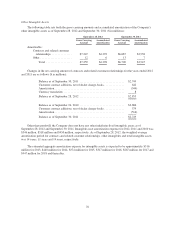
Other Intangible Assets
The following table sets forth the gross carrying amounts and accumulated amortization of the Company’s
other intangible assets as of September 28, 2012 and September 30, 2011 ($ in millions):
September 28, 2012 September 30, 2011
Gross Carrying
Amount
Accumulated
Amortization
Gross Carrying
Amount
Accumulated
Amortization
Amortizable:
Contracts and related customer
relationships .............. $7,247 $4,392 $6,687 $3,938
Other ...................... 12 6 13 7
Total .................. $7,259 $4,398 $6,700 $3,945
Changes in the net carrying amount of contracts and related customer relationships for the years ended 2012
and 2011 are as follows ($ in millions):
Balance as of September 30, 2011 ............................... $2,749
Customer contract additions, net of dealer charge-backs .............. 642
Amortization ................................................ (544)
Currency translation .......................................... 8
Balance as of September 28, 2012 ............................... $2,855
Balance as of September 24, 2010 ............................... $2,686
Customer contract additions, net of dealer charge-backs .............. 579
Amortization ................................................ (516)
Balance as of September 30, 2011 ............................... $2,749
Other than goodwill, the Company does not have any other indefinite-lived intangible assets as of
September 28, 2012 and September 30, 2011. Intangible asset amortization expense for 2012, 2011 and 2010 was
$546 million, $518 million and $450 million, respectively. As of September 28, 2012, the weighted-average
amortization period for contracts and related customer relationships, other intangibles and total intangible assets
was 14 years, 11 years and 14 years, respectively.
The estimated aggregate amortization expense for intangible assets is expected to be approximately $516
million for 2013, $440 million for 2014, $374 million for 2015, $317 million for 2016, $267 million for 2017 and
$947 million for 2018 and thereafter.
76