ADT 2012 Annual Report Download - page 187
Download and view the complete annual report
Please find page 187 of the 2012 ADT annual report below. You can navigate through the pages in the report by either clicking on the pages listed below, or by using the keyword search tool below to find specific information within the annual report.-
 1
1 -
2
-
3
-
4
-
5
-
6
-
7
-
8
-
9
-
10
-
11
-
12
-
13
-
14
-
15
-
16
-
17
-
18
-
19
-
20
-
21
-
22
-
23
-
24
-
25
-
26
-
27
-
28
-
29
-
30
-
31
-
32
-
33
-
34
-
35
-
36
-
37
-
38
-
39
-
40
-
41
-
42
-
43
-
44
-
45
-
46
-
47
-
48
-
49
-
50
-
51
-
52
-
53
-
54
-
55
-
56
-
57
-
58
-
59
-
60
-
61
-
62
-
63
-
64
-
65
-
66
-
67
-
68
-
69
-
70
-
71
-
72
-
73
-
74
-
75
-
76
-
77
-
78
-
79
-
80
-
81
-
82
-
83
-
84
-
85
-
86
-
87
-
88
-
89
-
90
-
91
-
92
-
93
-
94
-
95
-
96
-
97
-
98
-
99
-
100
-
101
-
102
-
103
-
104
-
105
-
106
-
107
-
108
-
109
-
110
-
111
-
112
-
113
-
114
-
115
-
116
-
117
-
118
-
119
-
120
-
121
-
122
-
123
-
124
-
125
-
126
-
127
-
128
-
129
-
130
-
131
-
132
-
133
-
134
-
135
-
136
-
137
-
138
-
139
-
140
-
141
-
142
-
143
-
144
-
145
-
146
-
147
-
148
-
149
-
150
-
151
-
152
-
153
-
154
-
155
-
156
-
157
-
158
-
159
-
160
-
161
-
162
-
163
-
164
-
165
-
166
-
167
-
168
-
169
-
170
-
171
-
172
-
173
-
174
-
175
-
176
-
 177
177 -
 178
178 -
 179
179 -
 180
180 -
 181
181 -
 182
182 -
 183
183 -
 184
184 -
 185
185 -
 186
186 -
 187
187 -
 188
188 -
 189
189 -
 190
190 -
 191
191 -
 192
192 -
 193
193 -
 194
194
 |
 |

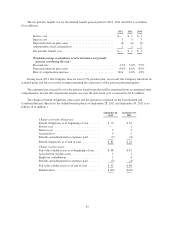
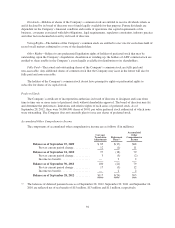
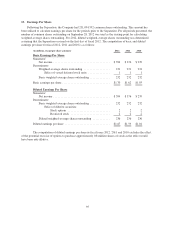
13. Earnings Per Share
Following the Separation, the Company had 231,094,332 common shares outstanding. This amount has
been utilized to calculate earnings per share for the periods prior to the Separation. For all periods presented, the
number of common shares outstanding on September 28, 2012 was used as the starting point for calculating
weighted-average shares outstanding. For 2012, diluted weighted-average shares outstanding was determined
assuming that the Separation occurred on the first day of fiscal 2012. The computation of basic and diluted
earnings per share for fiscal 2012, 2011 and 2010 is as follows:
(in millions, except per share amounts) 2012 2011 2010
Basic Earnings Per Share
Numerator:
Net income ....................................... $394 $376 $239
Denominator:
Weighted-average shares outstanding .................. 231 231 231
Effect of vested deferred stock units ...............111
Basic weighted-average shares outstanding .............. 232 232 232
Basic earnings per share ................................. $1.70 $1.62 $1.03
Diluted Earnings Per Share
Numerator:
Net income ....................................... $394 $376 $239
Denominator:
Basic weighted-average shares outstanding .............. 232 232 232
Effect of dilutive securities:
Stock options .............................222
Restricted stock ...........................222
Diluted weighted-average shares outstanding ............ 236 236 236
Diluted earnings per share ............................... $1.67 $1.59 $1.01
The computation of diluted earnings per share in fiscal years 2012, 2011 and 2010 excludes the effect
of the potential exercise of options to purchase approximately 0.8 million shares of stock as the effect would
have been anti-dilutive.
95