ADT 2012 Annual Report Download - page 160
Download and view the complete annual report
Please find page 160 of the 2012 ADT annual report below. You can navigate through the pages in the report by either clicking on the pages listed below, or by using the keyword search tool below to find specific information within the annual report.-
 1
1 -
2
-
3
-
4
-
5
-
6
-
7
-
8
-
9
-
10
-
11
-
12
-
13
-
14
-
15
-
16
-
17
-
18
-
19
-
20
-
21
-
22
-
23
-
24
-
25
-
26
-
27
-
28
-
29
-
30
-
31
-
32
-
33
-
34
-
35
-
36
-
37
-
38
-
39
-
40
-
41
-
42
-
43
-
44
-
45
-
46
-
47
-
48
-
49
-
50
-
51
-
52
-
53
-
54
-
55
-
56
-
57
-
58
-
59
-
60
-
61
-
62
-
63
-
64
-
65
-
66
-
67
-
68
-
69
-
70
-
71
-
72
-
73
-
74
-
75
-
76
-
77
-
78
-
79
-
80
-
81
-
82
-
83
-
84
-
85
-
86
-
87
-
88
-
89
-
90
-
91
-
92
-
93
-
94
-
95
-
96
-
97
-
98
-
99
-
100
-
101
-
102
-
103
-
104
-
105
-
106
-
107
-
108
-
109
-
110
-
111
-
112
-
113
-
114
-
115
-
116
-
117
-
118
-
119
-
120
-
121
-
122
-
123
-
124
-
125
-
126
-
127
-
128
-
129
-
130
-
131
-
132
-
133
-
134
-
135
-
136
-
137
-
138
-
139
-
140
-
141
-
142
-
143
-
144
-
145
-
146
-
147
-
148
-
149
-
 150
150 -
 151
151 -
 152
152 -
 153
153 -
 154
154 -
 155
155 -
 156
156 -
 157
157 -
 158
158 -
 159
159 -
 160
160 -
 161
161 -
 162
162 -
 163
163 -
 164
164 -
 165
165 -
 166
166 -
 167
167 -
 168
168 -
 169
169 -
 170
170 -
171
-
172
-
173
-
174
-
175
-
176
-
177
-
178
-
179
-
180
-
181
-
182
-
183
-
184
-
185
-
186
-
187
-
188
-
189
-
190
-
191
-
192
-
193
-
194
 |
 |
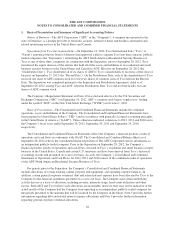
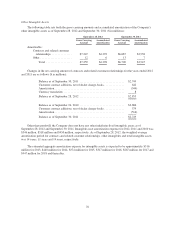
Intangible assets arising from the ADT dealer program described above are amortized in pools determined
by the same month and year of contract commencement on an accelerated basis over the period and pattern of
economic benefit that is expected to be obtained from the customer relationship. The estimated useful life of
dealer intangibles is 15 years. The accelerated method for amortizing these intangible assets utilizes an average
declining balance rate of 300% and converts to a straight-line methodology when the resulting amortization
charge is greater than that from the accelerated method, resulting in an average amortization of 67% of the pool
within the first five years, 22% within the second five years and 11% within the final five years.
Other amortizable intangible assets are amortized on a straight-line basis over 4 to 24 years. The Company
evaluates the amortization methods and remaining useful lives of intangible assets on a periodic basis to
determine whether events and circumstances warrant a revision to the amortization method or remaining useful
lives.
Long-Lived Asset Impairments—The Company reviews long-lived assets, including property and equipment
and amortizable intangible assets, for impairment whenever events or changes in business circumstances indicate
that the carrying amount of the asset may not be fully recoverable. The Company performs undiscounted
operating cash flow analyses to determine if impairment exists. For purposes of recognition and measurement of
an impairment for assets held for use, the Company groups assets and liabilities at the lowest level for which cash
flows are separately identified. If an impairment is determined to exist, any related impairment loss is calculated
based on fair value. Impairment losses on assets to be disposed of, if any, are based on the estimated proceeds to
be received, less costs of disposal.
Goodwill—Goodwill is assessed for impairment annually and more frequently if events or changes in
business circumstances indicate that it is more likely than not that the carrying value of a reporting unit exceeds
its fair value. See Note 4. In performing these assessments, management relies on various factors, including
operating results, business plans, economic projections, anticipated future cash flows and other market data.
There are inherent uncertainties related to these factors which require judgment in applying them to the testing of
goodwill for impairment. The Company performs its annual impairment tests for goodwill during the fourth
fiscal quarter of each year.
When testing for goodwill impairment, the Company first compares the fair value of its reporting unit with
its carrying amount. The estimated fair value of the reporting unit used in the goodwill impairment test is
determined utilizing a discounted cash flow analysis based on the Company’s forecasts discounted using market
participants’ weighted-average cost of capital and market indicators of terminal year cash flows. If the carrying
amount of the Company’s reporting unit exceeds its fair value, goodwill is considered potentially impaired and
step two of the goodwill impairment test is performed to measure the amount of impairment loss. In the second
step of the goodwill impairment test, the Company compares the implied fair value of the reporting unit’s
goodwill with the carrying amount of the reporting unit’s goodwill. If the carrying amount of the reporting unit’s
goodwill exceeds the implied fair value of that goodwill, an impairment loss is recognized in an amount equal to
the excess of the carrying amount of goodwill over its implied fair value. The implied fair value of goodwill is
determined in the same manner that the amount of goodwill recognized in a business combination is determined.
The Company allocates the fair value of its reporting unit to all of the assets and liabilities of that unit, including
intangible assets, as if the reporting unit had been acquired in a business combination. Any excess of the fair
value of its reporting unit over the amounts assigned to its assets and liabilities represents the implied fair value
of goodwill.
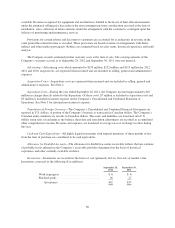
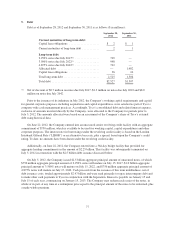
Accrued Expenses and Other Current Liabilities—Included in accrued and other current liabilities in the
Company’s Consolidated and Combined Balance Sheets are amounts for payroll-related accruals of $38 million
and $44 million as of September 28, 2012 and September 30, 2011, respectively. Also included in accrued and
other current liabilities are customer advances, which totaled $39 million and $36 million as of September 28,
2012 and September 30, 2011, respectively.
68