ADT 2012 Annual Report Download - page 136
Download and view the complete annual report
Please find page 136 of the 2012 ADT annual report below. You can navigate through the pages in the report by either clicking on the pages listed below, or by using the keyword search tool below to find specific information within the annual report.-
 1
1 -
2
-
3
-
4
-
5
-
6
-
7
-
8
-
9
-
10
-
11
-
12
-
13
-
14
-
15
-
16
-
17
-
18
-
19
-
20
-
21
-
22
-
23
-
24
-
25
-
26
-
27
-
28
-
29
-
30
-
31
-
32
-
33
-
34
-
35
-
36
-
37
-
38
-
39
-
40
-
41
-
42
-
43
-
44
-
45
-
46
-
47
-
48
-
49
-
50
-
51
-
52
-
53
-
54
-
55
-
56
-
57
-
58
-
59
-
60
-
61
-
62
-
63
-
64
-
65
-
66
-
67
-
68
-
69
-
70
-
71
-
72
-
73
-
74
-
75
-
76
-
77
-
78
-
79
-
80
-
81
-
82
-
83
-
84
-
85
-
86
-
87
-
88
-
89
-
90
-
91
-
92
-
93
-
94
-
95
-
96
-
97
-
98
-
99
-
100
-
101
-
102
-
103
-
104
-
105
-
106
-
107
-
108
-
109
-
110
-
111
-
112
-
113
-
114
-
115
-
116
-
117
-
118
-
119
-
120
-
121
-
122
-
123
-
124
-
125
-
 126
126 -
 127
127 -
 128
128 -
 129
129 -
 130
130 -
 131
131 -
 132
132 -
 133
133 -
 134
134 -
 135
135 -
 136
136 -
 137
137 -
 138
138 -
 139
139 -
 140
140 -
 141
141 -
 142
142 -
 143
143 -
 144
144 -
 145
145 -
 146
146 -
147
-
148
-
149
-
150
-
151
-
152
-
153
-
154
-
155
-
156
-
157
-
158
-
159
-
160
-
161
-
162
-
163
-
164
-
165
-
166
-
167
-
168
-
169
-
170
-
171
-
172
-
173
-
174
-
175
-
176
-
177
-
178
-
179
-
180
-
181
-
182
-
183
-
184
-
185
-
186
-
187
-
188
-
189
-
190
-
191
-
192
-
193
-
194
 |
 |

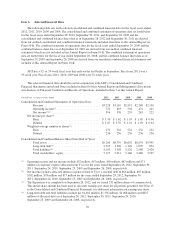
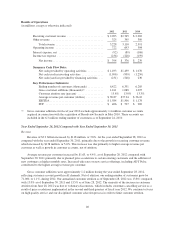
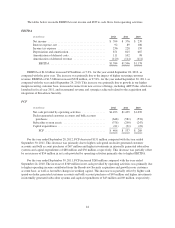
The tables below reconcile EBITDA to net income and FCF to cash flows from operating activities.
EBITDA
(in millions) 2012 2011 2010
Net income ........................................ $ 394 $ 376 $ 239
Interest expense, net ................................. 92 89 106
Income tax expense ................................. 236 228 159
Depreciation and amortization ......................... 871 825 687
Amortization of deferred costs ......................... 111 102 98
Amortization of deferred revenue ...................... (120) (114) (111)
EBITDA ...................................... $1,584 $1,506 $1,178
EBITDA of $1.6 billion increased $78 million, or 5.2%, for the year ended September 28, 2012, as
compared with the prior year. The increase was primarily due to the impact of higher recurring customer
revenue. EBITDA of $1.5 billion increased $328 million, or 27.8%, for the year ended September 30, 2011, as
compared with the year ended September 24, 2010. This increase was primarily due to growth in our higher
margin recurring customer base, increased revenue from new service offerings, including ADT Pulse, which we
launched in fiscal year 2011, and incremental revenue and synergies achieved related to the acquisition and
integration of Broadview Security.
FCF
(in millions) 2012 2011 2010
Net cash provided by operating activities ................ $1,493 $1,439 $1,070
Dealer generated customer accounts and bulk account
purchases ....................................... (648) (581) (532)
Subscriber system assets ............................. (378) (290) (247)
Capital expenditures ................................. (61) (31) (22)
FCF.......................................... $ 406 $ 537 $ 269
For the year ended September 28, 2012, FCF decreased $131 million compared with the year ended
September 30, 2011. This decrease was primarily due to higher cash spend on dealer generated customer
accounts and bulk account purchases of $67 million and higher investments in internally generated subscriber
systems and capital expenditures of $88 million and $30 million, respectively. This decrease was partially offset
by an increase of $54 million in net cash provided by operating activities primarily due to higher EBITDA.
For the year ended September 30, 2011, FCF increased $268 million compared with the year ended
September 24, 2010. The increase of $369 million in net cash provided by operating activities was primarily due
to higher operating income contributed from the Broadview Security acquisition and growth in our customer
account base, as well as favorable changes in working capital. This increase was partially offset by higher cash
spend on dealer generated customer accounts and bulk account purchases of $49 million and higher investments
in internally generated subscriber systems and capital expenditures of $43 million and $9 million, respectively.
44