ADT 2012 Annual Report Download - page 65
Download and view the complete annual report
Please find page 65 of the 2012 ADT annual report below. You can navigate through the pages in the report by either clicking on the pages listed below, or by using the keyword search tool below to find specific information within the annual report.-
 1
1 -
2
-
3
-
4
-
5
-
6
-
7
-
8
-
9
-
10
-
11
-
12
-
13
-
14
-
15
-
16
-
17
-
18
-
19
-
20
-
21
-
22
-
23
-
24
-
25
-
26
-
27
-
28
-
29
-
30
-
31
-
32
-
33
-
34
-
35
-
36
-
37
-
38
-
39
-
40
-
41
-
42
-
43
-
44
-
45
-
46
-
47
-
48
-
49
-
50
-
51
-
52
-
53
-
54
-
 55
55 -
 56
56 -
 57
57 -
 58
58 -
 59
59 -
 60
60 -
 61
61 -
 62
62 -
 63
63 -
 64
64 -
 65
65 -
 66
66 -
 67
67 -
 68
68 -
 69
69 -
 70
70 -
 71
71 -
 72
72 -
 73
73 -
 74
74 -
 75
75 -
76
-
77
-
78
-
79
-
80
-
81
-
82
-
83
-
84
-
85
-
86
-
87
-
88
-
89
-
90
-
91
-
92
-
93
-
94
-
95
-
96
-
97
-
98
-
99
-
100
-
101
-
102
-
103
-
104
-
105
-
106
-
107
-
108
-
109
-
110
-
111
-
112
-
113
-
114
-
115
-
116
-
117
-
118
-
119
-
120
-
121
-
122
-
123
-
124
-
125
-
126
-
127
-
128
-
129
-
130
-
131
-
132
-
133
-
134
-
135
-
136
-
137
-
138
-
139
-
140
-
141
-
142
-
143
-
144
-
145
-
146
-
147
-
148
-
149
-
150
-
151
-
152
-
153
-
154
-
155
-
156
-
157
-
158
-
159
-
160
-
161
-
162
-
163
-
164
-
165
-
166
-
167
-
168
-
169
-
170
-
171
-
172
-
173
-
174
-
175
-
176
-
177
-
178
-
179
-
180
-
181
-
182
-
183
-
184
-
185
-
186
-
187
-
188
-
189
-
190
-
191
-
192
-
193
-
194
 |
 |

capital expenditures and pension contributions; (vii) unbudgeted restructuring charges; (viii) charges related to
the Separation, and (ix) realignments of segment and corporate costs. Adjusted FCF was calculated by first
adjusting cash flow from operations by removing the effects of the sale of accounts receivable programs, cash
paid for purchase accounting and holdback liabilities, and voluntary pension contributions and then deducting net
capital expenditures (including accounts purchased from the ADT dealer network), and then adding back the
special items that increased or decreased cash flows. The customer attrition rate was a 52-week trailing ratio, the
numerator of which was the annualized recurring revenue lost during the period due to attrition, net of dealer
charge-backs and re-sales, and the denominator of which was total annualized recurring revenue during the
period based on an average of recurring revenue under contract at the beginning of each month during the period.
Dealer charge-backs represent customer cancellations charged by us to dealers because the customer cancelled
service during the initial period of the contract, generally 12 to 15 months. Revenue is calculated in constant
currency, which negates the impact of fluctuations in foreign currency over the course of the year, with
adjustments made to targets to reflect the acquisition or divestitures of businesses over the course of the fiscal
year (all shown in the table are the targets as adjusted for such items).
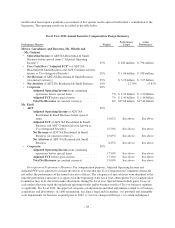
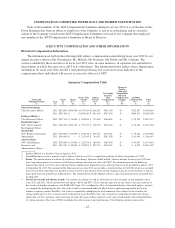
The table below shows the maximum and target annual incentive compensation opportunities for fiscal
2012, and the actual payments earned by each of our named executive officers. These amounts are reported in the
“Non-Equity Incentive Plan Compensation” column of the “Summary Compensation” table.
Fiscal Year 2012 Performance Bonus Summary
Named executive officer Maximum Target Actual
Naren Gursahaney $1,220,000 $610,000 $451,300
Kathryn Mikells (1) $ 979,200 $489,600 $166,865
Donald Boerema $ 320,356 $160,178 $129,744
Mark Edoff $ 408,000 $204,000 $170,952
Anita Graham $ 468,000 $234,000 $189,540
(1) Maximum and target amounts for Ms. Mikells represent annual amounts. Actual amount was pro-rated for
the 154 days of fiscal 2012 Ms. Mikells was employed by ADT.
The Tyco Compensation Committee and the independent members of the Tyco Board of Directors approved
award payouts for each of our named executive officers in November 2012 based on the achievement of the
minimum adjusted net income performance threshold of $450 million, and the achievement of the quantitative
performance measures shown in the “Fiscal 2012 Annual Incentive Compensation Design Summary” table
above. These results included a downward adjustment for inappropriate revenue recognition practices related to
certain security contracts in China, which resulted in adjustments to prior period financial statements dating back
to fiscal 2008. For purposes of the annual incentive plan, the Tyco Compensation Committee treated all charges
related to this matter as though they were incurred in fiscal 2012, effectively eliminating any benefit that the
named executive officers had received in prior years.
Long-Term Incentive Awards
For the fiscal 2012 annual equity grant, the Tyco Compensation Committee granted a mix of PSUs, stock
options and RSUs to our named executive officers. Mr. Gursahaney was granted equity awards under the Tyco
2004 SIP consisting of stock options (40%), PSUs (40%) and RSUs (20%). Messrs. Boerema and Edoff and
Ms. Graham were granted awards consisting of stock options (33%), PSUs (34%) and RSUs (33%). As
Ms. Mikells was hired after the first quarter of fiscal year 2012, she was not eligible to receive PSUs. She was
granted stock options (50%) and RSUs (50%).
Stock options granted by Tyco generally vested in equal installments over a period of four years, beginning
on the first anniversary of the grant date, and the exercise price equaled the fair market value of Tyco common
stock on the date of grant. Each option holder had 10 years to exercise his or her stock options from the date of
-39-