Ubisoft 2006 Annual Report Download - page 97
Download and view the complete annual report
Please find page 97 of the 2006 Ubisoft annual report below. You can navigate through the pages in the report by either clicking on the pages listed below, or by using the keyword search tool below to find specific information within the annual report.-
 1
1 -
2
-
3
-
4
-
5
-
6
-
7
-
8
-
9
-
10
-
11
-
12
-
13
-
14
-
15
-
16
-
17
-
18
-
19
-
20
-
21
-
22
-
23
-
24
-
25
-
26
-
27
-
28
-
29
-
30
-
31
-
32
-
33
-
34
-
35
-
36
-
37
-
38
-
39
-
40
-
41
-
42
-
43
-
44
-
45
-
46
-
47
-
48
-
49
-
50
-
51
-
52
-
53
-
54
-
55
-
56
-
57
-
58
-
59
-
60
-
61
-
62
-
63
-
64
-
65
-
66
-
67
-
68
-
69
-
70
-
71
-
72
-
73
-
74
-
75
-
76
-
77
-
78
-
79
-
80
-
81
-
82
-
83
-
84
-
85
-
86
-
 87
87 -
 88
88 -
 89
89 -
 90
90 -
 91
91 -
 92
92 -
 93
93 -
 94
94 -
 95
95 -
 96
96 -
 97
97 -
 98
98 -
 99
99 -
 100
100 -
 101
101 -
 102
102 -
 103
103 -
 104
104 -
 105
105 -
 106
106 -
 107
107 -
108
-
109
-
110
-
111
-
112
-
113
-
114
-
115
-
116
-
117
-
118
-
119
-
120
-
121
-
122
-
123
-
124
-
125
-
126
-
127
-
128
-
129
-
130
-
131
-
132
-
133
-
134
-
135
-
136
-
137
-
138
-
139
-
140
-
141
-
142
-
143
-
144
-
145
-
146
-
147
-
148
-
149
-
150
-
151
-
152
-
153
-
154
-
155
-
156
-
157
-
158
-
159
-
160
-
161
-
162
-
163
-
164
-
165
-
166
-
167
-
168
-
169
-
170
-
171
-
172
-
173
-
174
-
175
-
176
-
177
-
178
-
179
-
180
-
181
-
182
-
183
-
184
-
185
-
186
-
187
-
188
-
189
 |
 |

CONSOLIDATED FINANCIAL STATEMENTS AS OF MARCH 31, 2007
85
2
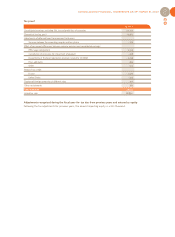
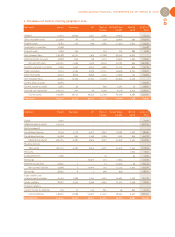
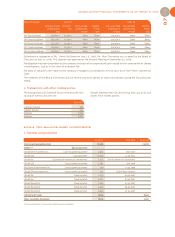
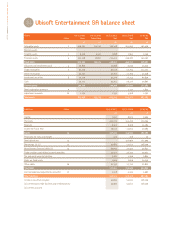
2. Breakdown of balance sheet by geographic area
Net assets France Germany UK Rest of United States Rest of 03.31.07
Europe Canada world Total
Goodwill 21,972 10,840 1,451 3,564 39,547 - 77,374
Other intangible assets 222,626 67 47 126 40,697 463 264,026
Tangible assets 9,765 127 599 1,064 11,333 2,622 25,510
Investments in associates 33,998 - - - - - 33,998
Financial assets 1,184 109 - 147 129 889 2,458
Inter-company flows 116,588 -13,251 -904 -12,168 -85,342 -4,923 -
Deferred income tax assets 14,808 644 66 1,122 19,397 1,593 37,630
Non-current assets 420,941 -1,464 1,259 -6,145 25,761 644 440,996
Inventory and work-in-progress 2,856 1,447 4,050 4,366 11,241 834 24,794
Trade receivables 6,115 -5,265 6,706 17,122 56,438 6,741 87,857
Other receivables 19,717 8,819 6,846 1,210 37,095 272 73,959
Inter-company flows 34,405 11,363 21,704 -11,108 -50,954 -5,410 -
Current financial assets 19,183 - - - - - 19,183
Current income tax assets 4,481 44 - 694 5,361 25 10,605
Cash and cash equivalents 106,723 307 46 9,436 6,118 3,922 126,552
Current assets 193,480 16,715 39,352 21,720 65,299 6,384 342,950
Total assets 614,421 15,251 40,611 15,575 91,060 7,028 783,946
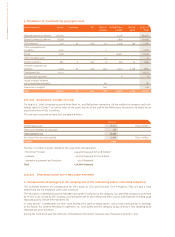
Liabilities France Germany UK Rest of United States Rest of 03.31.07
Europe Canada world Total
Capital 7,037 - - - - - 7,037
Additional paid-in capital 435,234 - - - - - 435,234
Equity component - - - - - - -
Consolidated reserves 8,534 3,278 4,457 2,843 18,381 1,497 38,990
Consolidated earnings 30,908 903 1,148 1,184 5,561 854 40,558
Equity (group share) 481,713 4,181 5,605 4,027 23,942 2,351 521,819
Minority interests - - - - - - -
Total equity 481,713 4,181 5,605 4,027 23,942 2,351 521,819
Provisions - - - - - 1,952 1,952
Employee benefits 1,066 - - 75 - 64 1,205
Borrowings - - 20,000 103 2,603 - 22,706
Deferred tax liabilities 13,632 3 - 13 14,530 36 28,214
Non-current liabilities 14,698 3 20,000 191 17,133 2,052 54,077
Borrowings 46,965 8 3 908 990 - 48,874
Trade creditors and
related accounts payables 42,504 1,886 5,193 4,921 24,483 2,191 81,178
Sundry creditors 28,387 9,147 9,596 4,697 22,512 1,556 75,895
Financial liabilities - - - - - - -
Current income tax liabilities 154 27 215 831 46 830 2,103
Current liabilities 118,010 11,068 15,007 11,357 48,031 4,577 208,050
Total liabilities 614,421 15,252 40,612 15,575 89,106 8,980 783,946