Ubisoft 2006 Annual Report Download - page 68
Download and view the complete annual report
Please find page 68 of the 2006 Ubisoft annual report below. You can navigate through the pages in the report by either clicking on the pages listed below, or by using the keyword search tool below to find specific information within the annual report.-
 1
1 -
2
-
3
-
4
-
5
-
6
-
7
-
8
-
9
-
10
-
11
-
12
-
13
-
14
-
15
-
16
-
17
-
18
-
19
-
20
-
21
-
22
-
23
-
24
-
25
-
26
-
27
-
28
-
29
-
30
-
31
-
32
-
33
-
34
-
35
-
36
-
37
-
38
-
39
-
40
-
41
-
42
-
43
-
44
-
45
-
46
-
47
-
48
-
49
-
50
-
51
-
52
-
53
-
54
-
55
-
56
-
57
-
 58
58 -
 59
59 -
 60
60 -
 61
61 -
 62
62 -
 63
63 -
 64
64 -
 65
65 -
 66
66 -
 67
67 -
 68
68 -
 69
69 -
 70
70 -
 71
71 -
 72
72 -
 73
73 -
 74
74 -
 75
75 -
 76
76 -
 77
77 -
 78
78 -
79
-
80
-
81
-
82
-
83
-
84
-
85
-
86
-
87
-
88
-
89
-
90
-
91
-
92
-
93
-
94
-
95
-
96
-
97
-
98
-
99
-
100
-
101
-
102
-
103
-
104
-
105
-
106
-
107
-
108
-
109
-
110
-
111
-
112
-
113
-
114
-
115
-
116
-
117
-
118
-
119
-
120
-
121
-
122
-
123
-
124
-
125
-
126
-
127
-
128
-
129
-
130
-
131
-
132
-
133
-
134
-
135
-
136
-
137
-
138
-
139
-
140
-
141
-
142
-
143
-
144
-
145
-
146
-
147
-
148
-
149
-
150
-
151
-
152
-
153
-
154
-
155
-
156
-
157
-
158
-
159
-
160
-
161
-
162
-
163
-
164
-
165
-
166
-
167
-
168
-
169
-
170
-
171
-
172
-
173
-
174
-
175
-
176
-
177
-
178
-
179
-
180
-
181
-
182
-
183
-
184
-
185
-
186
-
187
-
188
-
189
 |
 |

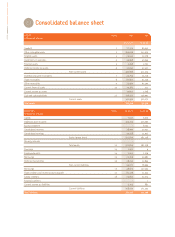
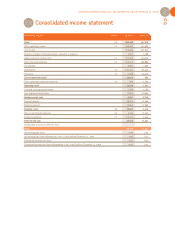
UBISOFT • FINANCIAL REPORT 2007
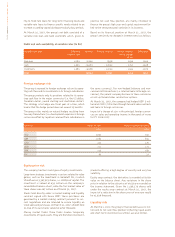
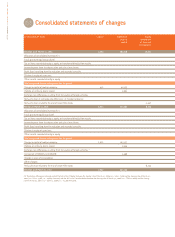
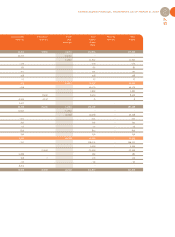
Consolidated statements of changes
2.3
in thousands of euros Capital Additional Equity
paid-in component
capital of financial
instruments
Situation as of March 31, 2005 5,594 282,018 10,651
Allocation of consolidated earnings N-1
Fiscal year earnings (Group share)
Tax on items recorded directly as equity or transferred directly from equity
Income/expense from the depreciation and sale of own shares
Profit (loss) resulting from the valuation and recorded as equity
Dilution in equity of associates
Other results recorded directly in equity
Total recognized income and expenses for the period
Change in capital of mother company 431 40,355
Options on ordinary shares issued 2,692
Exchange rate differences resulting from translation of foreign activities
Reclassification of exchange rate differences of merged companies
Reclassification related to the end of convertible bonds -2,447
Position at March 31, 2006 6,025 325,065 8,204
Allocation of consolidated earnings N-1
Fiscal year earnings(Group share)
Tax on items recorded directly as equity or transferred directly from equity
Income/expense from the depreciation and sale of own shares
Profit (loss) resulting from the valuation and recorded as equity
Dilution in equity of associates
Other results recorded directly in equity
Total recognized income and expenses for the period
Change in capital of mother company 1,012 105,357
Options on ordinary shares issued 3,344
Exchange rate differences resulting from translation of foreign activities (1)
Conversion of OBSAR and OCEANE 1,468
Change in scope of consolidation
Other changes
Reclassification related to the end of convertible bonds -8,204
Situation as of March 31, 2007 7,037 435,234 -
(1) Translation differences primarily reflect the fall in the US dollar between the closing rate of March 31, 2006 (€1 = US$ 1.2104) and the closing rate of March 31,
2007 (€1 = US$ 1.3318), i.e. -€9,665 thousand, and the fall in the Canadian dollar between the closing rate of March 31, 2006 (€1 = CDN$ 1.4084) and the closing
rate of March 31, 2007 (€1 = CDN$ 1. 5366), i.e. -€1,488 thousand.