Ubisoft 2006 Annual Report Download - page 117
Download and view the complete annual report
Please find page 117 of the 2006 Ubisoft annual report below. You can navigate through the pages in the report by either clicking on the pages listed below, or by using the keyword search tool below to find specific information within the annual report.-
 1
1 -
2
-
3
-
4
-
5
-
6
-
7
-
8
-
9
-
10
-
11
-
12
-
13
-
14
-
15
-
16
-
17
-
18
-
19
-
20
-
21
-
22
-
23
-
24
-
25
-
26
-
27
-
28
-
29
-
30
-
31
-
32
-
33
-
34
-
35
-
36
-
37
-
38
-
39
-
40
-
41
-
42
-
43
-
44
-
45
-
46
-
47
-
48
-
49
-
50
-
51
-
52
-
53
-
54
-
55
-
56
-
57
-
58
-
59
-
60
-
61
-
62
-
63
-
64
-
65
-
66
-
67
-
68
-
69
-
70
-
71
-
72
-
73
-
74
-
75
-
76
-
77
-
78
-
79
-
80
-
81
-
82
-
83
-
84
-
85
-
86
-
87
-
88
-
89
-
90
-
91
-
92
-
93
-
94
-
95
-
96
-
97
-
98
-
99
-
100
-
101
-
102
-
103
-
104
-
105
-
106
-
 107
107 -
 108
108 -
 109
109 -
 110
110 -
 111
111 -
 112
112 -
 113
113 -
 114
114 -
 115
115 -
 116
116 -
 117
117 -
 118
118 -
 119
119 -
 120
120 -
 121
121 -
 122
122 -
 123
123 -
 124
124 -
 125
125 -
 126
126 -
 127
127 -
128
-
129
-
130
-
131
-
132
-
133
-
134
-
135
-
136
-
137
-
138
-
139
-
140
-
141
-
142
-
143
-
144
-
145
-
146
-
147
-
148
-
149
-
150
-
151
-
152
-
153
-
154
-
155
-
156
-
157
-
158
-
159
-
160
-
161
-
162
-
163
-
164
-
165
-
166
-
167
-
168
-
169
-
170
-
171
-
172
-
173
-
174
-
175
-
176
-
177
-
178
-
179
-
180
-
181
-
182
-
183
-
184
-
185
-
186
-
187
-
188
-
189
 |
 |

CORPORATE ACCOUNTS OF UBISOFT ENTERTAINMENT SA AS OF MARCH 31, 2007
105
3
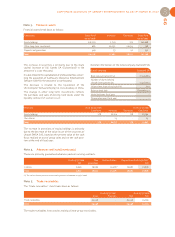
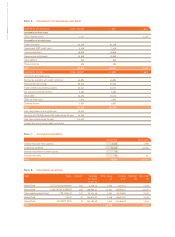
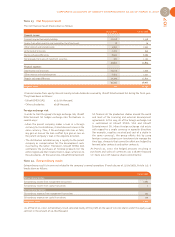
Capitalized production costs as of March 31, 2007 totaled €167,218 thousand and corresponded to development costs
subcontracted to subsidiaries. As of March 31, 2006, capitalized production costs totaled €132,260 thousand.
(*) Corresponds to deferred sales
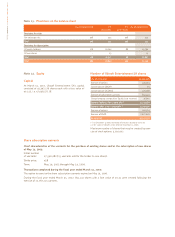
Transactions completed during the fiscal year ended March 31, 2007:
At its meeting of January 19, 2007, the Board of Directors voted in favor of the early redemption on February 26, 2007 of
the outstanding BSAR and bonds, in accordance with the provisions of Articles 2.2.7.3.2 and 2.5.6.1 of securities note
03-1001 of November 14, 2003 approved by the Autorité des Marchés Financiers. The early redemption of the BSAR
resulted in the redemption of the outstanding bonds.
During the fiscal year ended March 31, 2007, following the exercise of 1,313,907 BSAR: 69 shares with a face value of €0.31 and
2,627,676 shares with a face value of €0.155 were created.
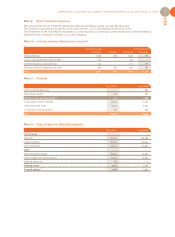
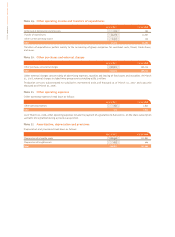
Note 16. Other debts
Note 17. Accrued expenses (adjustments accounts)
These consist primarily of margin calls on the equity swap contract (cf. Note 2.6.2 Off-balance-sheet commitments).
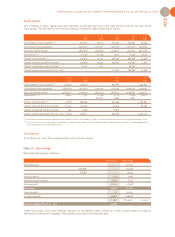
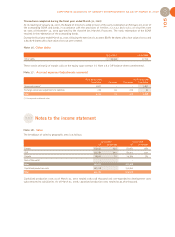
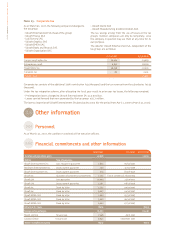
Note 18. Sales
The breakdown of sales by geographic area is as follows:
Notes to the income statement
3.5.7
03/31/2007 03/31/2006
Other debts 20,150 17,710
As of 03/31/2006 As of 03/31/2007
Cumulative Increases Decreases Cumulative
Unearned income* 3,857 - - 3,857
Exchange conversion adjustments to liabilities 276 61 276 61
Total 4,133 61 276 3,918
03/31/2007 03/31/2006
€K percentage €K percentage
Europe 115,051 43% 87,082 48%
USA 133,280 50% 80,502 44%
Canada 19,641 7% 14,384 8%
Rest of the world - -
Sales 267,972 181,968
Capitalized production costs 167,218 132,260
Total 435,190 314,228