Ubisoft 2006 Annual Report Download - page 48
Download and view the complete annual report
Please find page 48 of the 2006 Ubisoft annual report below. You can navigate through the pages in the report by either clicking on the pages listed below, or by using the keyword search tool below to find specific information within the annual report.-
 1
1 -
2
-
3
-
4
-
5
-
6
-
7
-
8
-
9
-
10
-
11
-
12
-
13
-
14
-
15
-
16
-
17
-
18
-
19
-
20
-
21
-
22
-
23
-
24
-
25
-
26
-
27
-
28
-
29
-
30
-
31
-
32
-
33
-
34
-
35
-
36
-
37
-
 38
38 -
 39
39 -
 40
40 -
 41
41 -
 42
42 -
 43
43 -
 44
44 -
 45
45 -
 46
46 -
 47
47 -
 48
48 -
 49
49 -
 50
50 -
 51
51 -
 52
52 -
 53
53 -
 54
54 -
 55
55 -
 56
56 -
 57
57 -
 58
58 -
59
-
60
-
61
-
62
-
63
-
64
-
65
-
66
-
67
-
68
-
69
-
70
-
71
-
72
-
73
-
74
-
75
-
76
-
77
-
78
-
79
-
80
-
81
-
82
-
83
-
84
-
85
-
86
-
87
-
88
-
89
-
90
-
91
-
92
-
93
-
94
-
95
-
96
-
97
-
98
-
99
-
100
-
101
-
102
-
103
-
104
-
105
-
106
-
107
-
108
-
109
-
110
-
111
-
112
-
113
-
114
-
115
-
116
-
117
-
118
-
119
-
120
-
121
-
122
-
123
-
124
-
125
-
126
-
127
-
128
-
129
-
130
-
131
-
132
-
133
-
134
-
135
-
136
-
137
-
138
-
139
-
140
-
141
-
142
-
143
-
144
-
145
-
146
-
147
-
148
-
149
-
150
-
151
-
152
-
153
-
154
-
155
-
156
-
157
-
158
-
159
-
160
-
161
-
162
-
163
-
164
-
165
-
166
-
167
-
168
-
169
-
170
-
171
-
172
-
173
-
174
-
175
-
176
-
177
-
178
-
179
-
180
-
181
-
182
-
183
-
184
-
185
-
186
-
187
-
188
-
189
 |
 |

UBISOFT • FINANCIAL REPORT 2007
Change
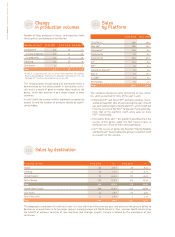
in production volumes Sales
by Platform
The company enjoyed an early positioning on new conso-
les, which accounted for 60% of the year’s sales:
Nintendo DS™ and Sony PSP™ portable consoles, repre-
sented all together 16% of sales during the year. Growth
was particularly high for Nintendo DS™, which benefited
from the success of the Petz®range and, more generally,
from that of the platform itself, while sales on Sony
PSP™ held steady.
Microsoft’s Xbox 360™: this platform benefited from the
success of the games under the Tom Clancy brand, in
particular as a result of their online gameplay.
Wii™: the success of games like Rayman®Raving Rabbids
and Red Steel™ have enabled the group to establish itself
as a leader on this console.
Number of titles produced in-house, co-productions (with
third parties), publishing and distribution:
The strong growth of publishing and distribution titles is
demonstrated by the sharp growth in distribution activi-
ties, and is a result of gains in market share made by the
group, which now position it as a major player in most
countries.
In 2007/2008, the number of titles marketed is expected to
exceed 70 and the number of products should be signifi-
cantly higher.
2006-2007 2005-2006
CD-ROM PC 16% 16%
Xbox 360™ 28% 14%
Nintendo Wii™ 14% 0%
PlayStation®3 2% 0%
PlayStation®2 16% 27%
DS™ 11% 6%
PSP™ 5% 9%
Game Boy® Advance™ 5% 7%
Xbox ® 1% 17%
G-CUBE™ 1% 3%
Miscellaneous 0% 1%
Total 100% 100%
* A title is a single game that runs on one or more platforms. For example,
Rayman Raving Rabbids™ PlayStation®2, Xbox360™, Nintendo Wii™, PC, and
Nintendo DS™ constitute five products but just one title.
Fiscal year (in M€) 2006-2007 % 2005-2006 %
France 64 9.5% 46 8.4%
Germany 49 7.2% 37 6.7%
United Kingdom 97 14.3% 82 15.0%
Rest of Europe 120 17.6% 105 19.3%
Total 330 48.6% 270 49.4%
United States/Canada 306 45.0% 245 44.8%
Asia-Pacific 33 4.8% 25 4.6%
Rest of the world 11 1.6% 7 1.2%
Total 680 100% 547 100%
The geographic breakdown of 2006/2007 sales is in line with that of the previous year and attests to the group’s ability to
develop on an equal basis in its two major regions, namely Europe and North America. Thus, whereas North America has
the benefit of advance launches of new machines and stronger growth, Europe is helped by the emergence of new
territories.
Sales by destination
1.2.4 1.2.5
1.2.6
Number of titles* 2006-2007 2005-2006 2004-2005
Development 24 19 27
In-house production 14 10 14
Co-production 10 9 13
Publishing 29 18 9
Distribution 4 2 1
Total 57 39 37