Ubisoft 2006 Annual Report Download - page 46
Download and view the complete annual report
Please find page 46 of the 2006 Ubisoft annual report below. You can navigate through the pages in the report by either clicking on the pages listed below, or by using the keyword search tool below to find specific information within the annual report.-
 1
1 -
2
-
3
-
4
-
5
-
6
-
7
-
8
-
9
-
10
-
11
-
12
-
13
-
14
-
15
-
16
-
17
-
18
-
19
-
20
-
21
-
22
-
23
-
24
-
25
-
26
-
27
-
28
-
29
-
30
-
31
-
32
-
33
-
34
-
35
-
 36
36 -
 37
37 -
 38
38 -
 39
39 -
 40
40 -
 41
41 -
 42
42 -
 43
43 -
 44
44 -
 45
45 -
 46
46 -
 47
47 -
 48
48 -
 49
49 -
 50
50 -
 51
51 -
 52
52 -
 53
53 -
 54
54 -
 55
55 -
 56
56 -
57
-
58
-
59
-
60
-
61
-
62
-
63
-
64
-
65
-
66
-
67
-
68
-
69
-
70
-
71
-
72
-
73
-
74
-
75
-
76
-
77
-
78
-
79
-
80
-
81
-
82
-
83
-
84
-
85
-
86
-
87
-
88
-
89
-
90
-
91
-
92
-
93
-
94
-
95
-
96
-
97
-
98
-
99
-
100
-
101
-
102
-
103
-
104
-
105
-
106
-
107
-
108
-
109
-
110
-
111
-
112
-
113
-
114
-
115
-
116
-
117
-
118
-
119
-
120
-
121
-
122
-
123
-
124
-
125
-
126
-
127
-
128
-
129
-
130
-
131
-
132
-
133
-
134
-
135
-
136
-
137
-
138
-
139
-
140
-
141
-
142
-
143
-
144
-
145
-
146
-
147
-
148
-
149
-
150
-
151
-
152
-
153
-
154
-
155
-
156
-
157
-
158
-
159
-
160
-
161
-
162
-
163
-
164
-
165
-
166
-
167
-
168
-
169
-
170
-
171
-
172
-
173
-
174
-
175
-
176
-
177
-
178
-
179
-
180
-
181
-
182
-
183
-
184
-
185
-
186
-
187
-
188
-
189
 |
 |
UBISOFT • FINANCIAL REPORT 2007
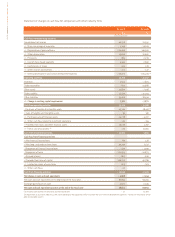
03.31.07 03.31.06
K€ K€
Cash flow from operating activities
Consolidated net income 40,558 11,932
+/- Share in earnings of associates - 3,149 - 19,109
+/- Depreciation of game software 214,499 146,100
+/- Other depreciation 15,619 12,692
+/- Provisions 884 2,776
+/- Cost of share-based payments 3,344 2,692
+/- Capital gains or losses 243 126
+/- Other income and expenses -221 - 147
+/- Internal development and license development expenses - 226,009 - 183,459 (2)
Operating cash flow 45,768 - 26,397
Inventory - 1,914 - 2,873
Trade receivables -842 54,688
Other assets - 34,830 - 7,048
Trade payables 11,539 - 32,204
Other liabilities 33,429 - 18,434
+/- Change in working capital requirement 7,382 - 5,871
Cash from operating actvities 53,150 - 32,268
- Purchases of tangible & intangible assets - 43,394 - 18,407 (2)
+ Sales of tangible and intangible assets 95 140
+/- Purchases/sales of financial assets - 15,778 - 4,227
+/- Other cash flow related to investment operations - 153 - 153
+ Proceeds from loans and other financial assets 16,078 3,787
+/- Partial sale of associates (1) 170 22,691
Cash from investment activities - 42,982 3,831
Cash flow from financing activities
+ New financial leasing loans 60 128
+ New long- and medium-term loans 30,740 7,537
- Repayment of financial leasing loans - 230 - 1,040
- Repayment of loans - 151,933 - 24,875
- Accrued interest - 807 - 650
+ Proceeds from issue of capital 106,551 40,786
+/- resales/purchases of own shares 625 - 503
+/- Other cash flows - 42 -
Cash from financing activities - 15,036 21,383
Net change in cash and cash equivalents - 4,868 - 7,054
Net cash and cash equivalents at the beginning of the fiscal year 80,894 90,493
Exchange gains/losses on cash 2,627 -2,545
Net cash and cash equivalents position at the end of the fiscal year 78,653 80,894
(1) Including cash position of companies purchased and sold - 17 22,697
(2) Adjustment at 31 march 2006 of 1,5 M€ corresponding to the acquisition of Far Cry from the line “Internal development expenses” to the line “Purchases of tan-
gible & intangible assets”.
Statement of changes in cash flow for comparison with other industry firms