Ubisoft 2006 Annual Report Download - page 49
Download and view the complete annual report
Please find page 49 of the 2006 Ubisoft annual report below. You can navigate through the pages in the report by either clicking on the pages listed below, or by using the keyword search tool below to find specific information within the annual report.-
 1
1 -
2
-
3
-
4
-
5
-
6
-
7
-
8
-
9
-
10
-
11
-
12
-
13
-
14
-
15
-
16
-
17
-
18
-
19
-
20
-
21
-
22
-
23
-
24
-
25
-
26
-
27
-
28
-
29
-
30
-
31
-
32
-
33
-
34
-
35
-
36
-
37
-
38
-
 39
39 -
 40
40 -
 41
41 -
 42
42 -
 43
43 -
 44
44 -
 45
45 -
 46
46 -
 47
47 -
 48
48 -
 49
49 -
 50
50 -
 51
51 -
 52
52 -
 53
53 -
 54
54 -
 55
55 -
 56
56 -
 57
57 -
 58
58 -
 59
59 -
60
-
61
-
62
-
63
-
64
-
65
-
66
-
67
-
68
-
69
-
70
-
71
-
72
-
73
-
74
-
75
-
76
-
77
-
78
-
79
-
80
-
81
-
82
-
83
-
84
-
85
-
86
-
87
-
88
-
89
-
90
-
91
-
92
-
93
-
94
-
95
-
96
-
97
-
98
-
99
-
100
-
101
-
102
-
103
-
104
-
105
-
106
-
107
-
108
-
109
-
110
-
111
-
112
-
113
-
114
-
115
-
116
-
117
-
118
-
119
-
120
-
121
-
122
-
123
-
124
-
125
-
126
-
127
-
128
-
129
-
130
-
131
-
132
-
133
-
134
-
135
-
136
-
137
-
138
-
139
-
140
-
141
-
142
-
143
-
144
-
145
-
146
-
147
-
148
-
149
-
150
-
151
-
152
-
153
-
154
-
155
-
156
-
157
-
158
-
159
-
160
-
161
-
162
-
163
-
164
-
165
-
166
-
167
-
168
-
169
-
170
-
171
-
172
-
173
-
174
-
175
-
176
-
177
-
178
-
179
-
180
-
181
-
182
-
183
-
184
-
185
-
186
-
187
-
188
-
189
 |
 |

THE GROUP'S ACTIVITY AND RESULTS FOR FISCAL YEAR 2006-2007
37
1
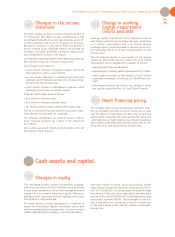
Change in working
capital requirement
(WCR) and debt
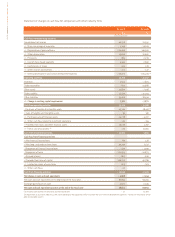
Working capital requirement fell in absolute value to
€66 million compared to €79 million last year, justified by
a €7 million improvement and a €6 million foreign
exchange impact. Given the growth in commercial activity,
this represents only 9.7% of sales compared with 11% the
previous year.
The net financial position is now positive by €55 million
versus net debt of €65 million in 2006. This €120 million
improvement can be attributed to a number of factors:
operating cash flow of €46 million,
improvement in working capital requirement of €7 million,
share capital increases in the amount of €107 million
essentially resulting of conversion of OCEANE and war-
rants,
investments totaling €43 million, €25 million of which
was used to acquire the Far Cry®and Driver®brands.
Asset financing policy
The company does not use securitization contracts, trans-
fers of receivables pursuant to France’s Dailly Law, or sales
with the option to repurchase, but does rely on factoring
and discounts, primarily in Germany and the UK. It also uses
confirmed lines of credit totaling €130 million (including a
€100 million syndicated loan) and short-term lines of cre-
dit to finance its cash requirements at peak times.
Changes in the income
statement
The gross margin was 66.5% of sales compared to 66% in
FY 2005/2006. This slight increase resulted from a high
percentage of sales (60%) on next-gen consoles, which off-
set the customary fall in prices of games on previous-
generation consoles. It also stems from the growth in
online revenue which, although modest (accounting for
less than 1% of sales), generates a margin of close to 100%
and is expected to increase in the future.
Current operating result before share-based payments was
€38.2 million versus €3.1 million in 2005/2006.
This increase is the result of:
a €91 million increase in the gross margin tied to the
sharp growth in sales (+ €133 million),
an €11 million reduction in marketing and structural
expenses, which represent less than 26% of sales compa-
red with 34% the previous year,
a €67 million increase in development expenses, which
represent 35% of sales, up nearly 4 points.
Financial result breaks down as follows:
€7.3 million in financial costs,
€1.7 million in foreign exchange losses,
€27 million positive impact linked to the equity swap.
The €3.1 million profit pertaining to the associates repre-
sents the share in Gameloft SA’s earnings.
The company recognized a tax expense of €15.2 million,
which includes research tax credits in the amount of
€1.9 million.
Net income was €40.6 million which translates into net
earnings per share of €0.95.
1.2.7 1.2.8
1.2.9
Cash assets and capital
1.3
Changes in equity
The video game business requires investments in develop-
ment in excess of 30% of sales. Publishers must be able to
finance these investments, which cover average periods of
around 18 to 24 months, using their equity. Moreover,
publishers must launch new licenses regularly, the success
rate of which is not guaranteed.
For these reasons, strong capitalization is essential to
ensure the financing of regular investments and to deal
with the unpredictability of a given title’s success or failure
without jeopardizing the company’s continued existence.
With €522 million in equity, up by €141 million, Ubisoft
easily finances its game investments, which total €226 mil-
lion. In FY 2006/2007, this equity again increased through
the exercise of the 2003 share subscription warrants and a
portion of the 2006 OCEANE and 2008 redeemable share
subscription warrants (BSAR), which brought in €96 mil-
lion. It also rose by €10 million as a result of increases tied
to the stock option plans and the company employees’
savings plan.
1.3.1