Ubisoft 2006 Annual Report Download - page 76
Download and view the complete annual report
Please find page 76 of the 2006 Ubisoft annual report below. You can navigate through the pages in the report by either clicking on the pages listed below, or by using the keyword search tool below to find specific information within the annual report.-
 1
1 -
2
-
3
-
4
-
5
-
6
-
7
-
8
-
9
-
10
-
11
-
12
-
13
-
14
-
15
-
16
-
17
-
18
-
19
-
20
-
21
-
22
-
23
-
24
-
25
-
26
-
27
-
28
-
29
-
30
-
31
-
32
-
33
-
34
-
35
-
36
-
37
-
38
-
39
-
40
-
41
-
42
-
43
-
44
-
45
-
46
-
47
-
48
-
49
-
50
-
51
-
52
-
53
-
54
-
55
-
56
-
57
-
58
-
59
-
60
-
61
-
62
-
63
-
64
-
65
-
 66
66 -
 67
67 -
 68
68 -
 69
69 -
 70
70 -
 71
71 -
 72
72 -
 73
73 -
 74
74 -
 75
75 -
 76
76 -
 77
77 -
 78
78 -
 79
79 -
 80
80 -
 81
81 -
 82
82 -
 83
83 -
 84
84 -
 85
85 -
 86
86 -
87
-
88
-
89
-
90
-
91
-
92
-
93
-
94
-
95
-
96
-
97
-
98
-
99
-
100
-
101
-
102
-
103
-
104
-
105
-
106
-
107
-
108
-
109
-
110
-
111
-
112
-
113
-
114
-
115
-
116
-
117
-
118
-
119
-
120
-
121
-
122
-
123
-
124
-
125
-
126
-
127
-
128
-
129
-
130
-
131
-
132
-
133
-
134
-
135
-
136
-
137
-
138
-
139
-
140
-
141
-
142
-
143
-
144
-
145
-
146
-
147
-
148
-
149
-
150
-
151
-
152
-
153
-
154
-
155
-
156
-
157
-
158
-
159
-
160
-
161
-
162
-
163
-
164
-
165
-
166
-
167
-
168
-
169
-
170
-
171
-
172
-
173
-
174
-
175
-
176
-
177
-
178
-
179
-
180
-
181
-
182
-
183
-
184
-
185
-
186
-
187
-
188
-
189
 |
 |

UBISOFT • FINANCIAL REPORT 2007
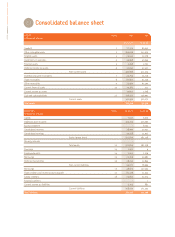
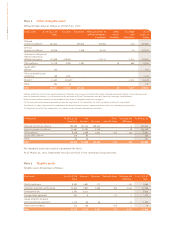
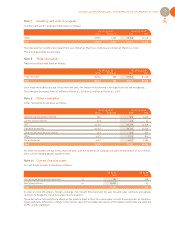
Deferred taxes are shown on the balance sheet as separate
items from current tax assets and liabilities and are classi-
fied as non-current items.
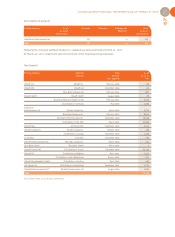
Segment information
In light of the group's organizational structure and the
commercial links among the various subsidiaries, we pro-
ceed on the basis that the group operates in a single mar-
ket in several geographic areas.
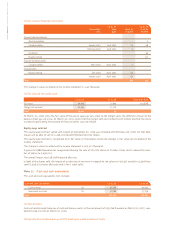
Dividends
No dividends were paid at March 31, 2007 on 2005/2006
earnings.
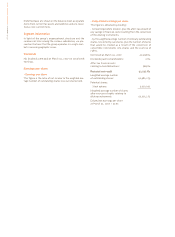
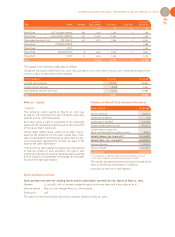
Earnings per share
• Earnings per share
This figure is the ratio of net income to the weighted ave-
rage number of outstanding shares less own shares held.
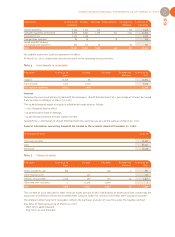
• Fully diluted earnings per share
This figure is obtained by dividing:
- net earnings before dilution, plus the after-tax amount of
any savings in financial costs resulting from the conversion
of the diluting instruments,
- by the weighted average number of ordinary outstanding
shares, less directly own shares, plus the number of shares
that would be created as a result of the conversion of
convertible instruments into shares and the exercise of
rights.
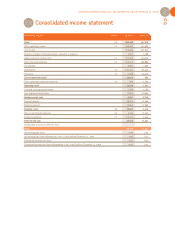
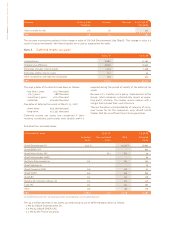
Net result at March 31, 2007: 40,558 K€
Dividends paid to shareholders: 0 K€
After tax financial costs
relating to bond debenture: 984 K€
Restated net result 41,542 K€
Weighted average number
of outstanding shares: 42,481,273
Potential shares:
Stock options 3,020,002
Weighted average number of shares
after exercise of rights relating to
diluting instruments 45,501,275
Diluted net earnings per share
at March 31, 2007 = €0.91