Ubisoft 2006 Annual Report Download - page 67
Download and view the complete annual report
Please find page 67 of the 2006 Ubisoft annual report below. You can navigate through the pages in the report by either clicking on the pages listed below, or by using the keyword search tool below to find specific information within the annual report.-
 1
1 -
2
-
3
-
4
-
5
-
6
-
7
-
8
-
9
-
10
-
11
-
12
-
13
-
14
-
15
-
16
-
17
-
18
-
19
-
20
-
21
-
22
-
23
-
24
-
25
-
26
-
27
-
28
-
29
-
30
-
31
-
32
-
33
-
34
-
35
-
36
-
37
-
38
-
39
-
40
-
41
-
42
-
43
-
44
-
45
-
46
-
47
-
48
-
49
-
50
-
51
-
52
-
53
-
54
-
55
-
56
-
 57
57 -
 58
58 -
 59
59 -
 60
60 -
 61
61 -
 62
62 -
 63
63 -
 64
64 -
 65
65 -
 66
66 -
 67
67 -
 68
68 -
 69
69 -
 70
70 -
 71
71 -
 72
72 -
 73
73 -
 74
74 -
 75
75 -
 76
76 -
 77
77 -
78
-
79
-
80
-
81
-
82
-
83
-
84
-
85
-
86
-
87
-
88
-
89
-
90
-
91
-
92
-
93
-
94
-
95
-
96
-
97
-
98
-
99
-
100
-
101
-
102
-
103
-
104
-
105
-
106
-
107
-
108
-
109
-
110
-
111
-
112
-
113
-
114
-
115
-
116
-
117
-
118
-
119
-
120
-
121
-
122
-
123
-
124
-
125
-
126
-
127
-
128
-
129
-
130
-
131
-
132
-
133
-
134
-
135
-
136
-
137
-
138
-
139
-
140
-
141
-
142
-
143
-
144
-
145
-
146
-
147
-
148
-
149
-
150
-
151
-
152
-
153
-
154
-
155
-
156
-
157
-
158
-
159
-
160
-
161
-
162
-
163
-
164
-
165
-
166
-
167
-
168
-
169
-
170
-
171
-
172
-
173
-
174
-
175
-
176
-
177
-
178
-
179
-
180
-
181
-
182
-
183
-
184
-
185
-
186
-
187
-
188
-
189
 |
 |

CONSOLIDATED FINANCIAL STATEMENTS AS OF MARCH 31, 2007
55
2
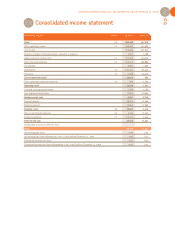
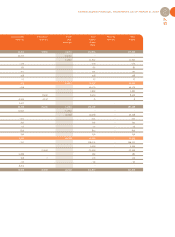
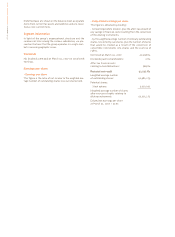
Consolidated income statement
2.2
in thousands of euros Notes 03.31.07 03.31.06
Sales 19 680,348 547,070
Other operating income 20 166,467 132,965
Cost of sales -229,969 -187,623
Inventory changes in finished products and work-in-progress 2,037 1,186
Wages and social security costs 21 -171,038 -140,674
Other operating expenses 22 -174,275 -186,883
Tax and duty -5,950 -4,906
Depreciation 23 -230,113 -81,302
Provisions 23 -2,568 -79,440
Current operating result 34,939 393
Other operating income and expenses 24 -360 -1,784
Operating result 34,579 -1,391
Cash and cash-equivalent income 1,476 2,183
Cost of gross financial debts -7,067 -10,693
Net borrowings costs -5,591 -8,510
Financial income 38,201 17,369
Financial expenses -14,563 -17,969
Financial result 25 18,047 -9,110
Share in earnings of associates 26 3,149 19,109
Income tax expense 27 -15,217 3,324
Profit for the year 40,558 11,932
Attributable to minority interests share --
Group 40,558 11,932
Net earnings per share 0.95 0.63
Net earnings per share following the 2-for-1 stock split on December 11, 2006 0.95 0.32
Diluted net earnings per share 0.91 0.70
Diluted net earnings per share following the 2-for-1 stock split on December 11, 2006 0.91 0.35