Ubisoft 2006 Annual Report Download - page 47
Download and view the complete annual report
Please find page 47 of the 2006 Ubisoft annual report below. You can navigate through the pages in the report by either clicking on the pages listed below, or by using the keyword search tool below to find specific information within the annual report.-
 1
1 -
2
-
3
-
4
-
5
-
6
-
7
-
8
-
9
-
10
-
11
-
12
-
13
-
14
-
15
-
16
-
17
-
18
-
19
-
20
-
21
-
22
-
23
-
24
-
25
-
26
-
27
-
28
-
29
-
30
-
31
-
32
-
33
-
34
-
35
-
36
-
 37
37 -
 38
38 -
 39
39 -
 40
40 -
 41
41 -
 42
42 -
 43
43 -
 44
44 -
 45
45 -
 46
46 -
 47
47 -
 48
48 -
 49
49 -
 50
50 -
 51
51 -
 52
52 -
 53
53 -
 54
54 -
 55
55 -
 56
56 -
 57
57 -
58
-
59
-
60
-
61
-
62
-
63
-
64
-
65
-
66
-
67
-
68
-
69
-
70
-
71
-
72
-
73
-
74
-
75
-
76
-
77
-
78
-
79
-
80
-
81
-
82
-
83
-
84
-
85
-
86
-
87
-
88
-
89
-
90
-
91
-
92
-
93
-
94
-
95
-
96
-
97
-
98
-
99
-
100
-
101
-
102
-
103
-
104
-
105
-
106
-
107
-
108
-
109
-
110
-
111
-
112
-
113
-
114
-
115
-
116
-
117
-
118
-
119
-
120
-
121
-
122
-
123
-
124
-
125
-
126
-
127
-
128
-
129
-
130
-
131
-
132
-
133
-
134
-
135
-
136
-
137
-
138
-
139
-
140
-
141
-
142
-
143
-
144
-
145
-
146
-
147
-
148
-
149
-
150
-
151
-
152
-
153
-
154
-
155
-
156
-
157
-
158
-
159
-
160
-
161
-
162
-
163
-
164
-
165
-
166
-
167
-
168
-
169
-
170
-
171
-
172
-
173
-
174
-
175
-
176
-
177
-
178
-
179
-
180
-
181
-
182
-
183
-
184
-
185
-
186
-
187
-
188
-
189
 |
 |

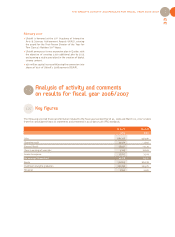
THE GROUP'S ACTIVITY AND RESULTS FOR FISCAL YEAR 2006-2007
35
1
The Ubisoft group’s sales are distributed over the three
core activities of the video game industry: development,
publishing and distribution.
Development covers revenues from titles developed, pro-
duced and marketed by Ubisoft's in-house studios. It also
includes sales coming from tittles created by third-party
developers for which Ubisoft provides supervisory and co-
production services and acts as guarantor of the final pro-
duct’s quality.
Publishing covers revenues from titles designed and pro-
duced by third-party developers for which Ubisoft finances
and supervises production in exchange for acquiring the
license. Ubisoft then handles localization and manufactu-
ring and is, of course, responsible for marketing and sales.
The company receives revenue from product sales and
pays royalties to the brand's developers and/or owners.
Distribution sales correspond to revenue from the sale of
products from publishers with which Ubisoft has signed dis-
tribution agreements and for which it handles marketing
and sales. Such agreements may be local, covering a limi-
ted geographical area, or may encompass several regions.
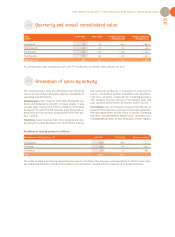
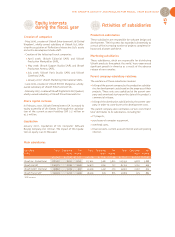
Breakdown of sales by activity (%) 2006-2007 2005-2006 Change in volume
Development 76% 85% - 11%
Publishing 18% 10% + 124%
Distribution 6% 5% + 86%
Total 100% 100%
At current rates, sales increased by 24% over FY 2006/2007; at constant rates, growth was 27%.
The sharp increase in publishing and distribution activities illustrates the company’s enhanced ability to attract more exter-
nal studios and publishers thanks to the quality of its distribution network and the expansion of its publishing teams.
Sales 2006-2007 2005-2006 Change at current Change at constant
(in M€) exchange rates exchange rates
First quarter 70 43 + 62% + 64%
Second quarter 102 110 - 7% - 4%
Third quarter 311 250 + 24% + 27%
Fourth quarter 197 144 + 37% + 42%
Total fiscal year 680 547 + 24% + 27%
Quarterly and annual consolidated sales
Breakdown of sales by activity
1.2.2
1.2.3
Breakdown of sales by activity is as follows: